The Price of Oil and the State of the Economy

A large number of people have been asking me about the price of oil and what it means for the economy. Rather than just repeating myself all the time, I am writing this article.

SOME CLARIFICATIONS

I feel it is important to clarify how the law of supply and demand works, because I hear a lot of incorrect analysis from people who should know better. If you understand the law of supply and demand, I recommend that you skip to the next section.

Consider the following statement: “The price of oil is falling, and this is increasing the demand for oil — this will push the price of oil back up!”

This proposition is completely wrong.

Let me show you an ordinary supply and demand graph, like anything you will see in an introductory economics textbook.

supply and demand

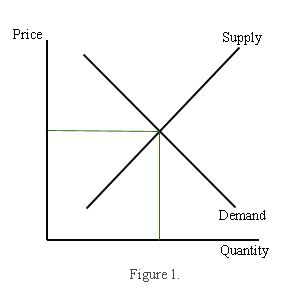
The x-axis is quantity, and the y-axis is price. The intersection of the demand curve and the supply curve is where the market clears — everyone can buy the amount they want to buy, and everyone can sell the amount they want to sell. Simple enough.

Now consider the following graph, which depicts a change in demand. Specifically, it shows an increase — the demand curve shifts to the right (D1 to D2).

What is happening here? Demand has increased, and the price goes up. What is not happening here? The increase was not caused by a lower price — instead, it caused an increase in the price. The rise in demand is the cause, the rise in price is the effect.

We know for a fact that the price of oil has fallen dramatically in the second half of 2014. Why? Reduced demand, increased supply, or both?

Much of the world is in economic trouble. China is slowing. Japan is a mess. Europe is a disaster. When much of the world is in recession or heading for recession, we expect the demand for oil to fall. And even in the US, where the economy is stronger, oil consumption has fallen 8% since 2010 (there are many reasons for this, but I will not go into it here). So falling demand is a reasonable explanation for the fall in oil prices.

There is also the issue of increasing supply. OPEC is still pumping, business as usual, even though the price is down. Shale oil producers have been producing in a frenzy. There is a greater supply of oil.

Here’s what it looks like:

The graph shows an increase in supply (the supply curve has shifted to the right). The market clears at a lower price. Less supply (S1) has become more supply (S2). The quantity demanded goes from Q1 to Q2.

The price of oil has been falling in the second half of 2014. It fell very fast. Supplies have not increased much since June. This makes me believe that falling demand is the primary cause in this situation.

Now let’s look at a situation where there is “inelastic” supply (meaning it is not very responsive to price) and a fall in demand.

This is an extremely “non-price-sensitive” supply. The Saudi head of oil production has proclaimed that they will keep pumping even if the price drops to $20 a barrel. The other producers need money, so they will keep pumping. They cannot trim production and influence the price. The Saudis have considerable influence in on the supply-side of the market. That’s why the supply is inelastic.

Let’s return to the initial proposition we considered: the oil price is lower, so there will be increased demand for oil. This is bad analysis. Part of the problem is in the fact that “demand” and “quantity demanded” are often used interchangeably. But essentially it is mixing up the issue in the first and second graphs.

The price of oil is down.  The supply has increased. The demand has not increased — the quantity demanded at the new price is greater than at the higher price. This is not the same as saying a lower price of oil will increase the demand for oil. An increase in demand would — in the language of economics — imply a rightward shift of the entire demand curve.

A falling price does not increase demand, it increased quantity demanded. These things sound similar, but they are analytically different and this is important to understand at an elementary level.

Now with that boring stuff out of the way, let us look at the current situation with the price of oil and the economy.

SHALLOW CONSPIRACY THEORIES

I regularly speak with a lot of presidents and CEOs in the Alberta oil industry. A commonplace view is that price collapse is all the result of the Saudis pushing down the price of oil because [insert reasons here].

There are some amusing conspiracy theories floating around as well, particularly that which avers the US and its Saudi allies are manipulating the oil price to drive down the price of oil to hurt some evil countries, like Russia (America’s archenemy) and Iran (Saudi Arabia’s archenemy).

(I want to quickly point out that this is perhaps the only time in my entire life where people have complained about oil market manipulation driving the price… DOWN! Usually it’s greedy capitalists or crooked OPEC producers manipulating the market to drive the price UP to rip everyone off. But I digress.)

Realistically, how much of the blame rests on the Saudis? Maybe some, sure. But I don’t think it’s that much.

After all, how much does Saudi Arabia have to do with the price of steel, coal, and iron ore?

stell

How much do the Saudis influence the price of copper (which, by the way, is almost as much of a barometer for the world economy as oil)?
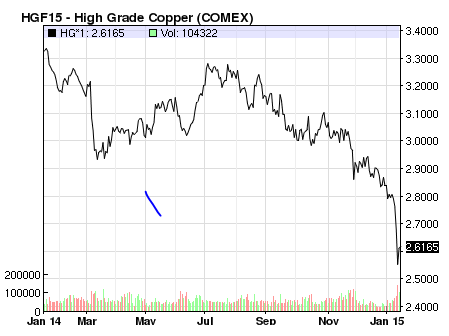
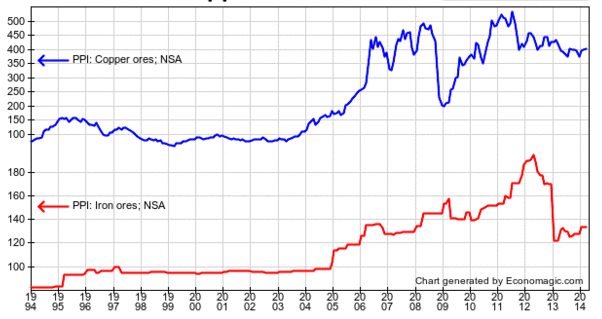
copper price

COMMODITY COLLAPSE

We see that oil is not the only commodity with a collapsing price. Maybe instead of market manipulation, it’s a sign that the global economy is not as strong as everyone had hoped.

The phony economic boom of the last two decades is slowing down, exposing what the Austrian business cycle theory refers to as “malinvestment.”

The distortion in commodity prices are the result of central banks collectively expanding their balance sheets from $5 trillion to $16 trillion in the last 10 years.

We also need to think about think about China, which has driven a great deal of the marginal demand for commodities in the last several cycles.

China’s radical growth levels were not going to last forever, and investors should have known better. But I guess that’s why they call it a “mania” and “irrational exuberance.”

China went from $1 trillion GDP to $9 trillion GDP in 13 years — an insane growth level that would be impossible but for printing press finance.

The incredible Keynesian-mercantilism started by Deng in the early 90s resulted in China’s demand for oil quadrupling from 3 million barrels per day to 12 million per day. Before then, the $20 price for a barrel of oil was, all things considered, was pretty much the same as it was 100 years when adjusted for inflation. Which makes sense given the basic balance of harder-to-get oil and improving technological methods over time.

The story is the same elsewhere. In the crackup boom phase of the cycle, iron ore prices hit 9x their historic range at the peak, and copper prices hit 5x their historic range.

copper iron

As with the other industrial commodities, there has been massive investment in petroleum production to feed the world’s unsustainable growth projections. Huge scale undertakings in the Canadian oil sands, US shale, and various deep-sea drilling projects, driven by these consumption forecasts and cheap credit, have resulted in major production increases. The bubble finance hype machine over the “Fracking revolution” in US shale led to a 4x increase in oil production with wells that would be uneconomical in a sane world.

So now there is too much oil production and not enough demand. The market needs to normalize, and that means the price of oil (and other commodities) needs to fall so sanity can be restored.

US shale in particular is a nasty bubble — the next “subprime” crisis.

North Dakota needs an oil price of around $55 per barrel at the wellhead and a fleet of about 140 rigs to sustain production at the current level of 1.2 million barrels per day, the U.S. state’s chief regulator told legislators on Thursday. . . . Breakeven rates for new wells, the level at which all drilling would cease, range from $29 in Dunn county and $30 in McKenzie to $36 in Williams and $41 in Mountrail. These four counties account for 90 percent of the drilling in the state.

Breakevens in counties on the periphery of the Bakken play, which have far fewer rigs, range up to $52 in Renville-Bottineau, $62 in Burke and $73 in Divide.

But Flint Hills Resources’ posted price for North Dakota crude was just $32, Helms said, compared with almost $49 per barrel for WTI. Wellhead prices, which are roughly an average of the two, are around $40 and have been falling since the start of this year.

Even before prices hit these minimum levels, drilling will slow sharply. The number of rigs operating in the state has already fallen to 165, down from 191 in October, according to the department. . . .

To keep output steady at 1.2 million b/d for the next three years, the state’s producers need a price of $55 rising closer to $65 in the longer term to support a fleet of 140-155 rigs.

Helms’ projections confirm North Dakota’s oil output will start to fall by the end of the year unless prices rise from their current very depressed level.

http://www.reuters.com/article/2015/01/09/bakken-oil-breakeven-kemp-idUSL6N0UO2QR20150109?feedType=RSS&feedName=rbssEnergyNews

Unlike conventional projects, shale wells enjoy an extremely short life. In the Bakken region straddling Montana and North Dakota, a well that starts out pumping 1,000 barrels a day will decline to just 280 barrels by the start of year two, a shrinkage of 72%. By the beginning of year three, more than half the reserves of that well will be depleted, and annual production will fall to a trickle. To generate constant or increasing revenue, producers need to constantly drill new wells, since their existing wells span a mere half-life by industry standards.

In fact, fracking is a lot more like mining than conventional oil production. Mining companies need to dig new holes, year after year, to extract reserves of copper or iron ore. In fracking, there is intense pressure to keep replacing the production you lost last year.

On average, the “all-in,” breakeven cost for U.S. hydraulic shale is $65 per barrel, according to a study by Rystad Energy and Morgan Stanley Commodity Research. So, with the current price at $48, the industry is under siege. To be sure, the frackers will continue to operate older wells so long as they generate revenues in excess of their variable costs. But the older wells–unlike those in the Middle East or the North Sea–produce only tiny quantities. To keep the boom going, the shale gang must keep doing what they’ve been doing to thrive; they need to drill many, many new wells.

Right now, all signs are pointing to retreat. The count of rotary rigs in use–a proxy for new drilling–has fallen from 1,930 to 1,881 since October, after soaring during most of 2014. Continental Resources, a major force in shale, has announced that it will lower its drilling budget by 40% in 2015. Because of the constant need to drill, frackers are always raising more and more money by selling equity, securing bank loans, and selling junk bonds. Many are already heavily indebted. It’s unclear if banks and investors will keep the capital flowing at these prices.

http://for.tn/1xLDxc9

I think long-term Canadian oil sand projects will have a stronger future, because they have more fundamental validity and less bubble finance hype (although there is some of that, of course). And while it it doesn’t seem like it to individual market participants, prices ultimately determine costs and so lower prices will push costs down. Rates of return in the market tend to equalize across different industries — there is not legitimate reason why people should forever expect above-market wages and investment returns in the oil business.

CENTRAL BANKS BACKING OFF?

Because I believe the Austrian business cycle theory is correct, I think China’s tightening of monetary policy has been a major factor here.

Likewise the Federal Reserve, with its 7x increase in the size of its balance sheet, culminating with a “taper” and proceeding into deflation mode following the end of QE3. That’s right, deflation mode. They did not just “taper” the rate of growth on the monetary base then hold it steady. The Fed actually sold off 10% of its assets starting in September before jumping back into open market operations with $250 billion in purchases. This kind of behavior is very disorienting for the market, with capital markets adjusting to money being sucked out and then pumped back in. But it helps explain the strengthening of the USD and the bloodshed in the commodities markets.

fed deflation

Then on Jan 15 came the Swiss National Bank’s surprise decision to end its foolhardy 1.20 EUR peg before Drahgi opened the ECB money floodgates. In its Keynesian desperation to diminish CHF purchasing power, the SNB’s balance sheet increased fivefold since the financial crisis and it amassed assets equal to 100% of the nation’s GDP — which is even more extreme than the insane BOJ, if you can believe it. With this development, the franc soared against the Euro and the US dollar and baffled everyone, even destroying a couple of FX firms overnight in one fell swoop.

Things will get crazy as some central banks tighten and others keep printing. These currency dislocations could lead to a currency crisis somewhere, but that is hard to predict. In any case, the insanity meter is in the red.

WHAT ABOUT GOLD?

Gold and oil often move together. And when the US dollar strengthens, gold usually weakens. But we are not really seeing this. Gold has been quite resilient amidst falling commodity prices and is performing well so far in 2015.

gold price

In this case, I’m not entirely sure what this means. On the one hand, it could indicate that a recession is less likely. On the other hand, it could indicate that investors are worried and are hedging against danger, like more aggressive central bank interventions.

CONCLUSION

The “correction” is healthy. It means reallocating resources to their most economical use. But it is painful — like a heroin addict going into detox.

It would be good for the world if oil went down to $20 a barrel and stayed there for 20 years, but I think the “peak oil” thesis is basically correct, and prices will rise again. We might not see a radical swing like in the 2008 crash, where we went from $37 back to $80 within the year.

The timing for all this depends on what happens in the recovery phase. Major readjustments need to occur. These adjustments could be brutal and quick, and the economy could resume a healthy course within a year, so long as the myriad governments take a “laissez-faire” approach. If governments impair economic adjustment with more taxes, spending, and inflation, we’ll just get a huge mess because the economy is straining against maximum debt levels and a huge bounce-back recovery a la 2008-2009 is not going to work this time.

So there you go. Prepare for some trouble. Hold cash.

Advertisement

Chinese Slowdown Puts a Drag on Energy Markets

Oil is the world’s most important commodity. Its market provides a good indication of where the economy is going.

The price of oil fell for five days before jumping today because of strong consumer confidence numbers in the US. The push down had been largely due to news from China.

Chinese manufacturing activity fell in May after months of slower growth. Its PMI hit a seven-month low of 49.6. A value below 50 indicates a contraction.

Oil consumption in OECD countries has fallen the last few years. In the rest of the world, it is has grown. The biggest of these consumers is China.

China is the world’s major exporter of manufactured goods. The decline in manufacturing activity implies the world’s slowing demand. This in turn will result in a reduced demand for energy.

China is a major factor in the marginal demand for oil. The oil price is not set by speculators, but supply and demand. Producers pump as much as they can. Chinese demand — in no small part driven by radical monetary expansion — is largely responsible for the boom in oil prices, from $20 a barrel in 2001 to current levels.

Chinese slowdown will cause oil prices to fall. When the economy is growing, oil prices rise because there is greater demand for energy. Prices fall when demand falls. This is elementary economics. The price of oil will decline.

— Read more at Marketwatch

Insider Buying of Junior Mining Stocks at Record Levels

Owning stocks in the junior mining sector is like holding a stick of soggy dynamite. With a good trade, your portfolio gets a growth explosion. With a bad trade, you explode.

These shares have taken a beating in 2013, creating huge opportunities for value. Insiders have no compunctions about scooping up shares at these low prices.

The INK Research Venture indicator was at 715% on April 30. This means that in the past 60 days, more than seven stocks on the TSX:V have insider buying for every stock with insider selling. Historically, this tends to foreshadow a rally in those prices.

In early March, this indicator was ‘only’ at 400%, so there has been a large increase. The current number is very close to its all time peak of 735% back on October 27, 2008. This preceded the bottoming-out of the Venture market in December 2008 by about six weeks. You may recall how that was a time when many people thought the world was going to end.

But wait. There is also a shorter-term 30-day Venture indicator. It hit 1229% on April 30.

Then there is the INK Gold Stock Indicator. This tracks insider buying on Canadian-listed gold stocks. There are more than 10 stocks with insider buying for every stock with insider selling. This indicator hit an all-time high of 1046% on April 26.

To be a successful investor, you have to be gutsy and buy when prices are low. Maybe insider buying patterns give some encouragement to acquire more soggy dynamite for your portfolio.

Read more in INK’s report

Australia to Join the World’s Orgy of Currency Debasement?

Australia’s mining boom is fading. Demand from China is slipping. The economy is going to contract. Yet their dollar is strengthening.

Central bankers are Keynesian-mercantilists that get bent out of shape when their own currencies are “too strong.” Especially when the economy is threatening to slow down. The bureaucrats at the RBA are no different.

What are they going to do? Try to hold down the price of the Australian dollar. They will join Europe, Japan, China, America, and the Swiss in the frenzy of currency debasement.

This is… a bad idea. Yet it is to be expected, as are the negative consequences it will create.

It might be best to start trading your Aussie dollars for something better. For other currencies, few good choices exist. I used to like the yen before Abenomics. Now I like the Singapore dollar.

Hardly any central bank  can resist racing to the bottom. I don’t think Australia’s can resist.

— Continue reading at Sunday Morning Herald —

Gold Is Better Protection than Silver

On March 6, I wrote about how gold holds up far better than silver when a panic hits.

Recent events seem to provide confirmation of this.

Silver at its peak was $48.70 in 2011. It is now at $23.29. This is a 52% loss — ouch. That is very painful for someone who bought near the top.

Gold has weathered the panic with much more success. In 2011, gold hit $1913 and it now is trading at $1391. This is only a 27% loss. Harsh, but not so harsh that you would want to throw yourself off a cliff.

As a speculative play, you could see big profits if you buy silver near the bottom. That’s because, relative to gold, silver is tremendously volatile. But you need to be careful: you may recall that during October 2008, silver traded below $9. Panics hits silver hard. Unless we enter Great Depression 2, I doubt silver will fall that low again — but I think it could certainly drop below $20 before this shake-up is resolved.

Is Now the Time to Get Out of the Stock Market?

Last week gold and silver got killed, especially after the rumor hit that Cyprus would sell gold to get a big fat bailout (honestly I doubt that will happen).

The slaughter continued today. I am writing this with gold at $1365. Margin calls are probably dropping left and right.

Other commodities have fallen, including oil. Bonds have rallied recently. The 30-year Treasury offers less than 3%, which is pretty much completely crazy. Meanwhile, Canada lost 54,000 jobs in March — the worst employment update in four years.

To me, these are pieces of data which imply an economic correction trying to work itself out, rather than a rippin’ recovery. If these developments justify concerns about a slowing economy, then you want to be careful about the mainstream coverage about this gold panic, and their general frenzy about  buying stocks.

US stocks, which are the hot ticket these days, seem to me dangerously high. Corporate earnings in the US are 70% above their historical average due to massive fiscal profligacy by government and citizenry, and aggressive cost-cutting post-2008. Periods of strong corporate profits are never permanent and eventually regress towards the mean. Therefore it should be expected that future earnings and dividends will disappoint.

The Fed is struggling to perpetuate the error cycle and keep the ‘recovery’ going.

Meanwhile, the TSX is not performing well this year, after being one of the world’s worst stock markets in 2012. And the TSX-V — which is where all the most exciting action is — is going to get smaller. The average level of cash held by TSX-V-listed stocks has fallen from $4.3 million in mid-2011 to about $2.8 million now. This might not sound too bad because it is still several times higher than pre-2008 levels, but on a per-share basis, it is terrible. TSX-V companies have only about 2.8 cents per share as of last quarter, a drop of more than 50% in two years. Remember, these companies don’t usually generate their own cash flows from any operations, and cash is frequently their only good asset. All the while, TSX-V companies have doubled their liabilities per share — so when the nearly 2.6 cents per share is paid off, they are basically broke. So while this says nothing about any individual companies, it suggests the junior resource sector is going to come up on some hard times.

I absolutely expect Canada and the US to join the other developed nations suffering from recession.

If you hold stocks at this time, you should seriously think about just selling most or all of them. Be ruthless about keeping only the absolute best ones. Keep the balance in cash and patiently await buying opportunities as prices fall.

If you are a long-term believer in gold, this is clearly a huge buying opportunity. Gold could still fall another 10-15% before hitting a bottom, and it could take a 6-12 months to recover. I would like to point out that during the previous gold market, there was a 20% price drop in late 1978.  We know how that turned out. Yet, if the fundamental argument for gold is still sound, then today’s prices are a godsend.

TSX Loses All Gains for 2013

The Canadian stock market was hit pretty hard as oil fell and gold got hammered. At the close, gold was down nearly $75 USD. The TSX lost all of its 2013 gains over the last few days.

I have predicted that North America will face recession this year, so a falling TSX is consistent with that. An economic correction is especially hard on capital goods industries and raw materials.

I also believe it is a reasonable expectation for gold to fall to $1200-$1300/oz as the economic error cycle matures. Then, when a panic hits, and Fed and other central banks will respond with further inflation, and the gold price will rise in response to that.

A commodity broker says: “the argument for gold as a safe haven or protection against inflation just isn’t there . . . It doesn’t look too good for gold.” This assumes there another crisis will not occur, and central banks will not inflate in response. At some point central banks will have to stop inflating to prevent currency collapse and preserve their nations’ banks, yes. Yet, I do not think that time is nigh because we have not yet seen massive consumer price inflation result from the monetary expansion since the ’08 financial crisis.

Read more at Financial Post.

Is the gold price being manipulated?

When oil prices rise, many economically illiterate people will say something like this:

“Speculators and oil companies are manipulating the market to drive up the price of oil.”

When there is a price change that people don’t like, it’s often blamed on “manipulation.” Did the price of gas rise in the summer? It’s those monopolistic oil companies.

Of course, no one ever blames the manipulators when the price of oil falls.

When it comes to gold and silver, people behave in a similar way. The difference is that people decry the “manipulators” and “conspiracies” when the price goes down.

I read Ed’s Gold and Silver Daily in the morning because I like the charts. I find it hard to read his commentary, because he is always blaming “da boys” for any price decline. Price declines which, he claims, are “impossible” in the free market. (For example, it’s claimed to be utterly incomprehensible that gold would fall in the post-Cyprus crisis, unless the cause of the decline is manipulation.)

Yet you will never hear Ed, or anyone like him, use manipulation to account for a price increase.

Gold and oil often move together. If gold is down, see if oil is down as well. If you think manipulators are driving down oil prices, then at least you are being consistent if you claim manipulators are driving down gold also. Yet no one ever blames manipulators for driving down oil prices.

In my opinion, people should not worry themselves over gold manipulation. So short-term futures traders might cause the market to move around a bit. But every short has a long. Futures traders do not want to manipulate the price downward if prices “should” be going up with massive shorts, because if so the market will rape them when price rises. Secondly, the banks that are supposedly manipulating gold prices lend huge amounts of money to gold producers. None of the board members of mining companies that I know believe there is manipulation.

And really: if the price of gold is being manipulated to a lower-than-otherwise level, why not just buy more? If someone drives the price of a commodity below what its market price “should be”, it would be… below the price at which it should be. Good deal. If some idiot like Gordon Brown (who sold half of Britain’s gold at hilariously low prices) wants to drive the price down, good luck. They obviously can’t keep it the price down forever.

Forget the manipulators. Here is why I think the gold price is falling: the economy is slowing down. Europe, Japan, and China are in recession. I believe North America is fighting hard to avoid one, but by the end of the year there will be nowhere left to run.

A panic will cause central bankers to inflate even more, and gold will move up in response to new monetary expansion. Otherwise, slowing economies are rough on investments. People want to avoid losses and gather cash, so they sell stuff like gold and stocks. When  demand deteriorates, prices drop. This is totally normal and not at all related to “manipulation.”

Investing: Silver vs. Gold

Many people want to know about silver. They want to know how it compares to gold as an investment.

Some call silver a “poor man’s gold.” In other words, the average man on the street is more able to go to a dealer and buy a few ounces of silver than he is a few ounces of gold. Yet “poor man’s gold” is not a fair characterization, because it assumes silver and gold belong in the same category simply because they are both precious metals. The reality is that silver and gold are different in important ways.

I recommend that one’s precious metal holdings be MAXIMUM 25% silver. 15% is probably better. Gold should make up the rest.

First, I invite you to check out the Kitco charts and look at recent price behavior.

In April 2011, silver reached a high of $49. But by June 2012, it hit $27. As I write this, it is $29. Measured from the 2011 highs, this is a massive loss. Nearly 50%.

Now look at gold. In September 2011, gold hit a high of $1895. In May 2012, it bottomed at $1540. As of right now, it is $1580. Measured from the 2011 highs, this is a moderate loss. Nearly 20%.

The idea reflected here is that silver is much more volatile.

Look back to 1980. Silver fell from $50 to $3.60 in 1991. Gold, at its worst, fell from $850 in 1980 to $255 in 2001. It’s like losing your house and all your money, instead of just all your money.

So when gold sells off, silver will sell off  harder and faster. Silver bulls will argue that the potential gains are much, much higher with silver than with gold. This is plausible, if only because silver is 40% down from its all time high and gold is 17% down from its all time high, and there are strong reasons to believe that both will move upwards.

Why the volatility? The primary reason is industrial demand, which for gold is very small. It is significant for silver, however. During a panic, the price for raw materials plummets.

Gold is different. You could say it commands a premium. This is essentially because gold is regarded as a monetary metal even though it is not money. Central banks buy and sell gold. They have it in their vaults. Central banks don’t stock silver. Wealthy people want gold in a crisis, and silver is much less interesting. Indian families buy it when their daughters get hitched. Asians use it to protect against inflation.  Silver really doesn’t serve that purpose, and I do not believe it will in the near future.

Silver will probably have a bigger bull market than gold by the time Great Depression 2 hits. But if you want to buy precious metals because you are afraid of people like Bernanke and Carney, then you want gold. Silver is a higher risk trade. Gold will perform better in a panic, which is when silver will perform horribly.

In either case, your objective is to hold until the error cycle reaches its final moments before we enter a deflationary depression. Because at that point, you want to unload all your gold and silver and get currency and bonds from institutions that won’t go broke. It’s a trade that would be harder to time correctly with silver than with gold.

All this being said, there is one other important advantage gold has over silver: your wife or girlfriend will like gold jewelry more than silver jewelry.

What is up with the gold price?

The first two months of 2013 have erased gold’s price gains from 2012.

So what? The gold market is a bumpy ride. Are you sure you are man enough to own gold until Great Depression 2?

If you’ve been buying gold coins throughout the last decade, you probably don’t even care much about the current situation. You might even welcome a bit of weakness in the market as a chance to get more value.

I’ve been telling people to buy and hold gold coins for ten years. I still recommend doing so. The latest developments in the gold price don’t upset me much. I barely think about it.

Late-comers to the gold scene are the ones who are stressed out. You might be upset if you purchased your first gold coin last year, or bought into some gold ETF at the mid-2012 lows. You’ve heard bullish predictions for $2000 gold, $2500 gold, $3000 gold, but you’ve seen the price action over the last 12 months. You hear all the news stories reporting bearish sentiment on gold, and you worry. Your “Get Rich Quick” scheme has failed.

People get frightened when their holdings fall 5%, 10%, and 20%. I consider price changes, even big price changes, to be normal. But then again, most of my trades are in highly speculative stocks that frequently rise or fall 20% in one day. So price volatility upsets me less than most.

I would not be surprised if gold fell another 20% from its current point. Actually, I predict this will occur within a year. Recession will drive down asset prices. Asia is in recession. Europe is in recession. The US is going into recession. As the US goes, so goes Canada.

Also critical is Federal Reserve policy. Much has been made of the Federal Reserve minutes from February 21, where it was suggested the economy was improving and the size of their bond purchases may need to be “adjusted” — which was interpreted to mean “lowered.” I don’t think this holds much meaning. It’s just talk. The Federal Reserve has no “exit plan” prepared.

Instead, it is highly significant that the Federal Reserve did not inflate last year. In terms of gross open market operations, the Fed was busy. But on net, the balance sheet did not increase. This puts downward pressure on gold’s price. QE3 is now underway, but gold’s price already jumped last year in anticipation of the inflation that would create.

Other central banks are inflating and buying gold — mainly Asian central banks, and Russia. The trend indicates these purchases will continue — but in the grand scheme of the gold market, these deals are small. Japan’s central bank has gone into “suicide mode” and seems eager to ruin the yen.

Bernanke recently testified in Congress that interest rates had risen and that indicated improvement in the economy. Let us assume that is true — what interest rates have risen? Two-year to 30-year rates have been falling. Only the shortest-term rates have risen, and not significantly. 90-Day went up five-hundredths of a percent in February, and nobody cares.

The economy is getting worse, not better. Central banks’ money printing will become more frenzied.

Don’t worry about short-term fluctuations in the gold price. If you believe that there will be long-term worldwide mass inflation, then you should continue to accumulate  gold coins until it comprises a significant (25% to 40%) of your net worth.

%d bloggers like this: