Danger: Yield Curve Is Giving Us Economic Warning Signs

Canada’s yield curve is looking very scary. It has almost completely inverted and this is typically an indicator of coming recession.

An inverted yield curve occurs when short-term bond yields are higher than long-term yields.

Fear creates this situation. Lower returns are expected.

Borrowers, worried about liquidity issues, become desperate for capital in the short-term that they will pay higher rates for a 90-day loan than a 30-year loan. Lenders fear falling interest rates so they bid up the price for long-term bonds, lowering the long-term yield further.

This combination of factors inverts the yield curve, which is otherwise “normal” in the sense that longer-term rates are higher due to inflation and risk.


yield curve


This is a warning to our fellow Canadians. Consider locking in some long-term rates before they fall further and shift some more assets to cash.


Advertisement

[Chart]: The Federal Reserve Is Deflating

After QE3, the Federal Reserve began holding the monetary base fairly steady at around $4 trillion.

In the last 12-months the Fed seems to have begun unwinding some of its holdings. monetary-base

It helps to show the monetary base with a “zoomed out” chart in this case because it makes the signs of a deflationary trend more pronounced when you can see the 2008 crisis and the steep climbs with each round of QE.

This is truly uncharted territory, but it tells us two things: the next president, whether it’s Clinton or Trump, will face a big recession. People will blame the presidency instead of the Federal Reserve, and we will have only a one-term Trump or Clinton presidency.

It also tells us that we might want to stock up on some US dollars.

The US Stock Market Seems Like a Bad Joke

cotd20160926

Thanks to David Stockman.

A Bleak Update on Tourmaline Oil Corp. (TOU)

This summer CMR published a report on Tourmaline Oil Corp (TOU). We showed that the company sucked up cash harder than a black hole and becoming economically viable was nigh mathematically impossible.

Their strategy has been nothing more than bigness. They were not building a strong company and making acquisitions with internally generated cash, Instead, they gobbled up the proceeds fed to them by fanciful underwriters to buy assets so they could constantly trumpet record production numbers and drive up the share price. While Tourmaline’s C-suite speculators kept devouring funds with their capex and M&A binge, they were striving for a Hail Mary liquidity event when some bigger E&P company would hopefully buy them at a nice valuation.

The company just released its Q3 results and has only provided further support to this thesis. Tourmaline is still spending too much money with little to show for it. CMR analyst Daniel Plainview provides us with an update.

Tourmaline Oil Corp.; Q3 Update

A follow up from the quill of Daniel Plainview, Esq.

It has been a number of months since I took to this forum to share with the fine readers the patent market absurdity that is Tourmaline Oil.  While its shares have fallen since the summer (about 30%) this is by no means out of line with the declines of other Canadian oil gas companies.

Recently another quarter of financial results was announced, so perhaps it is a good time to see if this company has finally made a dollar.

tourmaline update

Nope.

(Also note that we have updated the chart to now include proceeds from asset sales; technically a positive cash flow item, as asset acquisitions would be negative. Not that it matters much.)

In the six months of new financial data we can see that Tourmaline continues to outspend what it takes in, in an effort to grow production (to lead to more of the same?)

Cash flow from operations were together another C$ 412 million, but spending (net of $0 new asset sales) was C$ 719 million.  Free cash flow was therefore -C$ 307 million for the last 6 months, bringing the grand total money pit to ~C$4.35 billion since 2009.

A positive development might be that it appear the company is now aware that they cannot promulgate cash flow and earning figures without the accompanying capital expenditures that drive the production.  In their October 14th press release they have budgeted free cash flow projections for 2016 and 2017.  In a low gas price scenario they free cash flow will be ~C$45 million followed by ~C$167 million, and in a high gas price scenario free cash flow will be ~C$103 million and ~C$414 million.

So hypothetically, at the high price scenario, investors might see positive cumulative free cash flow some time in the 2020s, but I won’t hold my breath.

Also worth noting is that the low gas price scenario assumes a median C$3.25/mcf price for Alberta natural gas.  Presently it sits at ~$2.40/GJ (or ~$2.53/mcf); so they only need their base commodity price to go up 28% too.

This is a company that grows production at any cost and has never had an economic business model.  It requires constant issuance of new shares and cannot maintain growth on a per share basis if valuations drop.  It is a house of cards waiting to fall.

It’s enough to make Tourmaline shareholders sweat.

Is Quebec’s Valeant (VRX) a Wall Street Ponzi Scheme?

David Stockman says so.

Market Lemmings Case Study: Tourmaline Oil Corp.

The fall in oil prices is starting to expose some of the waste in the energy sector, but this central bank fueled bubble is still rife with clusters of error.

The ‘boom’ phase of the business cycle — more accurately described as the malinvestment phase — is where a lot of things just stop making sense. People will shovel money into wasteful investments based on distorted credit conditions and hyped up expectations.

Today our case study is Tourmaline Oil Corp., a favorite in the independent energy growth company category. With a 52-week high of $58.73, the consensus analyst rating is “buy” while presently trading around $39 at 18x earnings. It recently issued $168 million in new shares (at $39.50/share).

CMR analyst Daniel Plainview shows why Tourmaline is an economic black hole relying on the “greater fool.” Regardless of whatever distortions manifest in the stock market, Tourmaline is its present form is a zombie company — not an investment, but just one of many ways to gamble in the stock market casino.

A Question for Tourmaline Oil Corp.: How Do You Make Money?

By Daniel Plainview

When trying to determine the proper price of a stock the conventional rule of thumb is to predict the amount of money that stock is going to make each year over the long term, and then discount those earnings to the present at an appropriate rate for the risk you are taking.

The inverse of this, but it is in essence the exact same methodology, is to use a Price to Earnings ratio to evaluate a stock. The higher the ratio, the more expensive the stock; the lower the ratio, the more likely you are getting a good deal, so long as the future earnings hold up.

But what if the stock you are looking at is in an industry that typically doesn’t make any money?  I’m referring to industries where the company earnings are often affected, to a large degree, by depletion expenses.

Depletion is a non-cash charge and it can ensure that a company generates plenty of cash flow but renders the conventional Price to Earnings analysis moot. Industries with high DD&A (Depletion, Depreciation & Amortization) are generally involved in resource extraction.

Because earnings are essentially meaningless for a lot of resource companies (not to mention the other accounting tricks that can affect earnings) it’s always a good idea to look at a company’s cash flows.  There are three types of cash flows:

  1. Cash flows from operations
  2. Cash flows from investing
  3. Cash flow from financing

While in any given period the cash flows in any of these buckets can be either positive or negative, over the medium to longer term (2+ years) one invariably wants to see that cash flow from operations is positive, cash flows from investing is slightly negative, and cash flows from financing is also negative; with the change in cash position from period to period being immaterial.

What a positive/negative/negative cash flow segmentation is indicative of is 1) the company is making money, 2) that it is reinvesting in the business to grow the business, and 3) it is able to return capital to the shareholder, or at least doesn’t steadily require new financing to fund its investments.

It is with this in mind that we now consider the Canadian oil and gas industry.

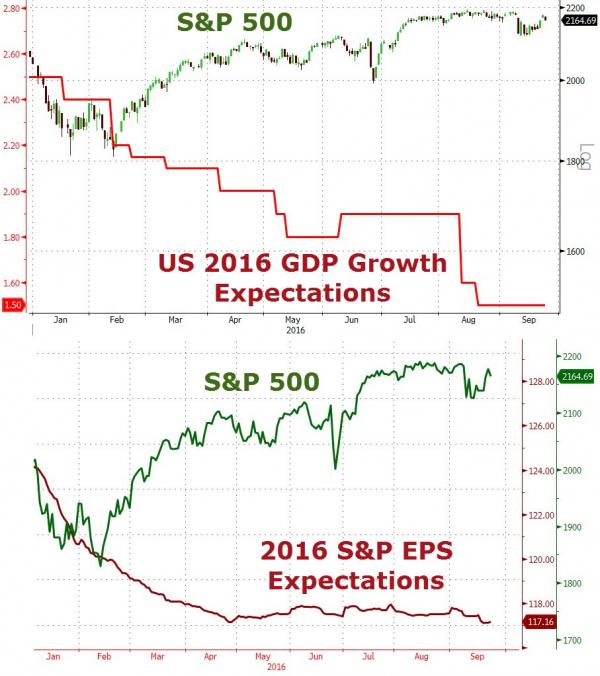
Recently the commodity prices that drive the cash flow from operations that Exploration and Production (E&P) companies generate took a tumble.  Both oil and gas prices fell by ~50% from their levels in the first half of 2014.

By itself a single year of lousy prices shouldn’t erode as much value in the markets as what occurred, but what changed is the market is now more pessimistic about prices for all future periods too.

Companies have responded by scaling back their investing, and cutting capital expenditures for the drilling of new wells and building of new facilities.

Generally speaking, oil and gas companies always have to be spending some money on new production in order to maintain overall production levels.  Well performance declines over time, and by how much depends a lot on the geology of the particular “play”.

A really good well might only decline at ~20% per year, but it still declines.  Newer unconventional extraction methods (drilling horizontal multi-stage frac wells into shales) can come down a lot faster: ~50% per year.

So ultimately the goal of any oil and gas company, in any environment, is to have enough cash flow from operations that it can pay for all the cash flow from investing (capital expenditures needed to keep production up), and still have enough left over to pay the shareholder.

Enter Tourmaline Oil: the oil company that has 85% of their production coming from natural gas.  Etymology aside, there are more serious issues with this company’s business model.

In their last earnings announcement in March, they happily proclaimed their 76% growth in cash flow. Sounds good… but wait! There is a footnote: “Cash flow is defined as cash provided by operations before changes in non-cash operating working capital.” So what about capital expenditures?

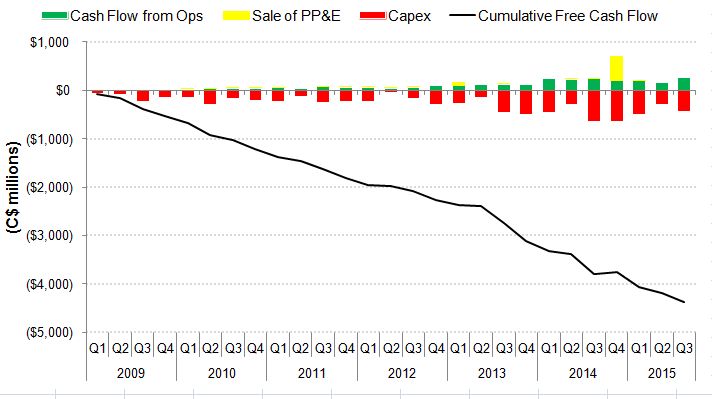
Here is a chart of Tourmaline’s cash flows, going back to 2009:

tourmaline

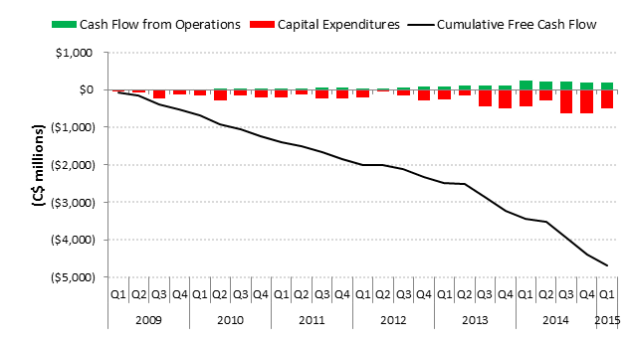
The cash flow from operations is in green, and the company’s capital expenditures (only a sub-set of cash flow from investing) are in red.  The black line represents the cumulative amount of cash flow from operations minus capital expenditures (or Free Cash Flow) up to each period.

What this shows is that Tourmaline has spent almost $4.7 billion more on drilling holes in the ground, than it has made from the hydrocarbons those holes have produced, since 2009.  Furthermore, over 25 quarters of results, they have never made more money than they spent: Free Cash Flow has never been positive.

In the company’s defense, they have grown production at an industry-leading rate.  But it really looks like they’re spending a dollar to make fifty cents, and making up for it on volume.

It has gotten to the point where if the company stopped spending money, but continued to earn cash flow from operations (and let us assume the same prices and only a 20% production annual decline), they could not make that money back.  In actuality Tourmaline’s wells probably decline a lot harder than 20%, but the story is bad enough as it is.

These harsh realities force us to ask the question: where did the company get $4.7 billion?  The answer is that they got it from new investors who bought shares in secondary offerings, and some money from raising debt.  It looks as though this external funding process will have to continue ad infinitum; another secondary offering being announced just recently for $168 million.

And investors should keep this in mind: the only reason Tourmaline is able to grow production on a per share basis is because the shares have a decent valuation, but the only reason the shares manage to eke out a decent valuation is because they are able to grow production on a per share basis.  If the shares were to fall enough in price, the amount of dilution created by external financing would make it impossible for the company to grow.

And the last point to make about the company: the management team in prior iterations at Berkeley and at Duvernay were able to successfully build up and then sell the company to a bigger fish.  Duvernay in particular made a lot of people a lot of money as it was sold at the height of the commodity boom in 2008 and Shell paid an unmatched valuation in the transaction (~27x EBITDA).

In fact, the only way Tourmaline’s business model makes any sense is with an M&A exit strategy: ramp up production at any price, and find a sucker to buy it just before the house of cards collapses.

But if investors are assuming Tourmaline will be similarly sold I would only point out that Tourmaline is now worth about $9.2 billion and is the 8th largest E&P company by market capitalization in Canada.  It’s getting to be too big for others to swallow, and suckers like Shell might be hard to find this time around.

Then again, they did just find another 4.25 million suckers…

(Click here for supporting calculations.)

RED ALERT! Canada’s Yield Curve is Inverting

The yield curve in Canada shows signs of inverting. We need to watch this carefully as it is a strong indicator that we are heading towards a recession.

This week the rate on 3-month Canadian t-bills went higher than all the other rates out to the 5-year bond.

Here’s why this is important:

The yield curve is a graphical representation of the interest rates for debt instruments over different maturity dates. It normally looks something like this:

normal yield

Economic actors prefer present goods to future goods, so future goods can only be exchanged for present goods at a discount. This gives rise to the phenomenon of interest (hence the term “discount rate” in finance when determining the present value of future cash flows).

The normal yield curve shows that the farther out in time you go for the maturity date, the higher the interest rate. There are two basic reasons. First, there is the issue of inflation, and lenders must take into account the depreciation of the monetary unit over time. Because the money supply is always expanding, the purchasing power of money tends to fall over time. Money paid back in the future is worth less with each passing year.

The second reason for the normal yield curve shape is that the default risk increases over time. The risk of default might be quite low over one year. But over ten years? Twenty years? Uncertainty is greater over that time period. The longer the debt takes to mature, the more one is subject to default risk, and so lenders compensate for this by demanding a higher rate of return.

This explains the shape of the normal yield curve.  But there are unusual situations where the yield curve inverts — the short maturity end of the curve has a higher rate than longer-term debt.  This is not normal, for reasons that should be obvious in light of the preceding discussion.

Putting aside the yield on the 1-month t-bill, we can usually assume that if the 3-month t-bill has a higher rate than the 30-year bond, the economy is going into a recession.

This implies a short-term liquidity crunch. Borrowers are starting to panic over their misguided investments due to artificially low short-term rates. They see impending losses. They will pay more for a 90-day loan than for a locked-in 5-year loan.

Meanwhile, the lenders are growing fearful about the short-term state of the economy as well. A recession pushes interest rates lower because the economy is weaker. Lenders are willing to give up the inflation premium they normally require. They nail down today’s higher long-term rates by purchasing more long-term bonds — which raises their price, and pushes down the rate.

Remember, when central banks are expanding the money supply, they buy up short-term t-bills to bid up their prices and push down their yields. The monetary expansion misallocates capital — investors and businessmen put more money into projects than the “real” economy can support, hence the “boom” phase preceding the “bust.” An inverted yield curve — rising short-term rates — signifies a liquidity shortage. Money is desperately needed right now to sustain capital projects.

(A detailed scholarly treatment of this issue can be found here — it’s a Ph.D dissertation, so it’s interesting albeit kind of dull).

So the inversion of the yield curve normally signals a recession. However, the yield curve is not fully inverted. The 3-month bill’s rate is still less than the 10- and 30-year bond rate. But these longer-term rates are plummeting rapidly.

Look at this 10-year yield totally nosediving:

10 year falling

And the 30-year treasury bond is plummeting as well — investors are giving the Canadian government their money for 1.833%, when just four weeks ago it was 2.3%. A year ago it was a solid 100 bps higher. Investors are giving Ottawa their money for less than 2% for 30 years. The world has gone insane.

(Although if it makes you feel better, it’s even more insane over in Europe. I mean seriously, people are lending the government of France — FRANCE! — money for 10-years at 0.5%. What the heck?! But it’s sweet deal when you’re a primary dealer and can just buy total crap like French 10-year bonds and flip it to the ECB.)

Despite the Bank of Canada’s recent surprise rate cut, the Bank of Canada has been significantly slowing the rate of growth of its asset purchases in recent months, as I reported a few weeks ago.

boc jan15

At the same time, down south, the Federal Reserve — the central bank of our biggest trading partner — has ended QE3 and its balance sheet no longer showing any net growth.

fedmbasejan30

I am not clear how the BoC’s recent rate cut will factor into this, nor am I clear what Yellen and the Fed will do if the US economy shows signs of panic (QE4?), but I think the inversion of our yield curve is related to all this. Remember, short-term rates are lowered by periods of central bank monetary expansion because they buy up debt at the short end of the curve with newly created money. All signs have pointed to the end or at least slow down of high monetary inflation by these central banks. Businessmen who thought all this investment in capital was justified because of distorted interest rates are getting a wake-up call. The truth is manifesting in the debt markets.

So watch the yield curve in Canada closely in the near future. If the 3-month rate goes above the 30-year rate, I’d say there is a 90% chance of recession within six months. If the inversion doesn’t go all the way out to the 30-year, then it may not indicate recession but it still suggests slower growth going forward.

What’s Going on with the Bank of Canada’s Assets?

It looks like the Bank of Canada is slowing the growth of the monetary base.

The Bank of Canada has been printing money like crazy in the last few years, beating up the dollar to artificially juice up exports, which supposedly, according to Keynesian-mercantilists like Poloz, stimulates the economy. (It doesn’t — it just means Canadians have to sell more stuff to buy the same amount of imports, which actually makes the country poorer.)

So a slowdown, or flattening, of the BoC’s frenzied asset buying is definitely a good thing. Especially as the American dollar is strengthening considerably.

South of the border, the Fed looks like it might be reversing its recent deflationary actions, where it had sold off a surprising 10% of its assets.

fed deflationMaintaining the “boom” phase of the business cycle requires an ever-increasing rate of monetary expansion. So these actions will put huge strain on their respective economies.

It often takes about a year for the effects of monetary policy to really be felt throughout the system. If the stabilization path continues, then Canada will probably go into a recession later this year.

HAPPY NEW YEAR!


The Central Planning Gambit: Can Central Banks Avoid a Crash?

The Bank for International Settlements put out its annual report on June 29. It says that the recovery is driven primarily by new fiat money generated by central banks. As a result, the pricing of capital assets is badly distorted. The overall theme is Austrian, not Keynesian.

Here is the summary:

A new policy compass is needed to help the global economy step out of the shadow of the Great Financial Crisis. This will involve adjustments to the current policy mix and to policy frameworks with the aim of restoring sustainable and balanced economic growth.

The global economy has shown encouraging signs over the past year but it has not shaken off its post-crisis malaise. Despite an aggressive and broad-based search for yield, with volatility and credit spreads sinking towards historical lows, and unusually accommodative monetary conditions, investment remains weak. Debt, both private and public, continues to rise while productivity growth has extended further its long-term downward trend. There is even talk of secular stagnation. Some banks have rebuilt capital and adjusted their business models, while others have more work to do.

To return to sustainable and balanced growth, policies need to go beyond their traditional focus on the business cycle and take a longer-term perspective — one in which the financial cycle takes centre stage. They need to address head-on the structural deficiencies and resource misallocations masked by strong financial booms and revealed only in the subsequent busts. The only source of lasting prosperity is a stronger supply side. It is essential to move away from debt as the main engine of growth.

Resources have been grossly misallocated by these interventions. Chapter VI begins with the following observations:

Nearly six years after the apex of the financial crisis, the financial sector is still coping with its aftermath. Financial firms find themselves at a crossroads. Shifting attitudes towards risk in the choice of business models will influence the sector’s future profile. The speed of adjustment will be key to the financial sector again becoming a facilitator of economic growth.

The banking sector has made progress in healing its wounds, but balance sheet repair is incomplete. Even though the sector has strengthened its aggregate capital position with retained earnings, progress has not been uniform. Sustainable profitability will thus be critical to completing the job. Accordingly, many banks have adopted more conservative business models promising greater earnings stability and have partly withdrawn from capital market activities.

Looking forward, high indebtedness is the main source of banks’ vulnerability. Banks that have failed to adjust post-crisis face lingering balance sheet weaknesses from direct exposure to overindebted borrowers and the drag of debt overhang on economic recovery (Chapters III and IV). The situation is most acute in Europe, but banks there have stepped up efforts in the past year. Banks in economies less affected by the crisis but at a late financial boom phase must prepare for a slowdown and for dealing with higher non-performing assets.

Then it discusses commercial banks — they are relying on the low interest rate environment to keep submarginal borrowers afloat. This is postponing inevitable losses.

In the United States, non-performing loans tell a different story. After 2009, the country’s banking sector posted steady declines in theaggregate NPL ratio, which fell below 4% at end-2013. Coupled with robust asset growth, this suggests that the sector has madesubstantial progress in putting the crisis behind it. Persistent strains on mortgage borrowers, however, kept the NPL ratios of the two largest government-sponsored enterprises above 7% in 2013.Enforcing balance sheet repair is an important policy challenge in the euro area. The challenge has been complicated by a prolonged period of ultra-low interest rates. To the extent that low rates support wide interest margins, they provide useful respite for poorly performing banks. However, low rates also reduce the cost of – and thus encourage – forbearance, ie keeping effectively insolvent borrowers afloat in order to postpone the recognition of losses. The experience of Japan in the 1990s showed that protracted forbearance not only destabilises the banking sector directly but also acts as a drag on the supply of credit and leads to its misallocation (Chapter III). This underscores the value of the ECB’s asset quality review, which aims to expedite balance sheet repair, thus forming the basis of credible stress tests.

The holy grail of central banking is this: shrink asset bubbles without crashing the economy.

No central bank has ever accomplished this. Yet monetary central planners have big egos — they think they are the smartest people in the entire universe. Right now, they think they have the economy under their control — unemployment slowly falling, economic activity slowly improving, and consumer price inflation is nowhere in sight.

Business cycle “recovery” phases (even weak ones) can’t last forever. The question is, can they pull off their ultimate gambit?

If central banks can unwind the massive increases to their balance sheets without causing recessions, it will show that Keynesian economics works. It will be nothing short of a miracle.

Do you believe in miracles?

Bank of Canada Has More Assets Than Ever

The Bank of Canada’s balance sheet is now bigger than ever. The central bank grows fat on the debts created by Ottawa.

boc may14

The rate of growth had slowed a bit in recent months, but the latest data tells us that Governor Poloz really doesn’t know what to do other than create new money and buy stuff. This is exasperating the business cycle and driving down the price of the Canadian dollar.

The Bank of Canada’s assets are 99% Canadian government bills and bonds. Buying more of these bids up their prices and pushes interest rates lower than they would be otherwise.

The newly created money enters the capital markets, and begins distorting the market’s allocation of resources. This is the cause of business cycles.

Interestingly, rates are so low in Canada that capital is nearly free, but the Eastern economy is still a mess. According to Keynesianism, the entire country should be on the verge of Utopia.

The aggressive monetary policy was kicked off by Carney, shortly after selling off the Bank’s emergency acquisitions of the financial crisis. Poloz is continuing this policy. He is trying to juice the Canadian economy by driving down the value of the Canadian dollar, thereby increasing exports, as he told us in his April 16 rate decision. This kind of short-sighted and special-interest-serving policy is to be expected from central bankers, particularly ones who worked Export Development Canada for more than a decade, like Poloz.

Hilariously, a few days ago the mainstream media churned out a puff piece about how Poloz is the “king” of central bankers and other central bankers want to be like him. The article presents Poloz as a really cool dude because when he says something, the Canadian dollar’s value is more greatly affected than the value of other currencies when their central bankers talk.

It never seems to occur to anyone that this is a horrible, horrible thing. It shows that the dollar is dangerously sensitive to the whims of central bankers, and that is not healthy for an economy. Uncertainty due to regulatory hazard is destructive to economic opportunity.

But of course, words are one thing, and the biggest impact on the economy emerges from the BoC’s actions — i.e. printing money. And as we can see, the Bank of Canada still going full steam ahead with that plan.

%d bloggers like this: