Canada Has Sold Off All Its Gold Reserves
March 3, 2016 Leave a comment
As of today, Canada has no more gold reserves.
This is a process that has been going on since the 1960s, when Canada had 1,000 tons of gold reserves.
Now they have zero.
Markets, Freedom, and Truth
March 3, 2016 Leave a comment
As of today, Canada has no more gold reserves.
This is a process that has been going on since the 1960s, when Canada had 1,000 tons of gold reserves.
Now they have zero.
January 31, 2015 Leave a comment
The yield curve in Canada shows signs of inverting. We need to watch this carefully as it is a strong indicator that we are heading towards a recession.
This week the rate on 3-month Canadian t-bills went higher than all the other rates out to the 5-year bond.
Here’s why this is important:
The yield curve is a graphical representation of the interest rates for debt instruments over different maturity dates. It normally looks something like this:

Economic actors prefer present goods to future goods, so future goods can only be exchanged for present goods at a discount. This gives rise to the phenomenon of interest (hence the term “discount rate” in finance when determining the present value of future cash flows).
The normal yield curve shows that the farther out in time you go for the maturity date, the higher the interest rate. There are two basic reasons. First, there is the issue of inflation, and lenders must take into account the depreciation of the monetary unit over time. Because the money supply is always expanding, the purchasing power of money tends to fall over time. Money paid back in the future is worth less with each passing year.
The second reason for the normal yield curve shape is that the default risk increases over time. The risk of default might be quite low over one year. But over ten years? Twenty years? Uncertainty is greater over that time period. The longer the debt takes to mature, the more one is subject to default risk, and so lenders compensate for this by demanding a higher rate of return.
This explains the shape of the normal yield curve. But there are unusual situations where the yield curve inverts — the short maturity end of the curve has a higher rate than longer-term debt. This is not normal, for reasons that should be obvious in light of the preceding discussion.
Putting aside the yield on the 1-month t-bill, we can usually assume that if the 3-month t-bill has a higher rate than the 30-year bond, the economy is going into a recession.
This implies a short-term liquidity crunch. Borrowers are starting to panic over their misguided investments due to artificially low short-term rates. They see impending losses. They will pay more for a 90-day loan than for a locked-in 5-year loan.
Meanwhile, the lenders are growing fearful about the short-term state of the economy as well. A recession pushes interest rates lower because the economy is weaker. Lenders are willing to give up the inflation premium they normally require. They nail down today’s higher long-term rates by purchasing more long-term bonds — which raises their price, and pushes down the rate.
Remember, when central banks are expanding the money supply, they buy up short-term t-bills to bid up their prices and push down their yields. The monetary expansion misallocates capital — investors and businessmen put more money into projects than the “real” economy can support, hence the “boom” phase preceding the “bust.” An inverted yield curve — rising short-term rates — signifies a liquidity shortage. Money is desperately needed right now to sustain capital projects.
(A detailed scholarly treatment of this issue can be found here — it’s a Ph.D dissertation, so it’s interesting albeit kind of dull).
So the inversion of the yield curve normally signals a recession. However, the yield curve is not fully inverted. The 3-month bill’s rate is still less than the 10- and 30-year bond rate. But these longer-term rates are plummeting rapidly.
Look at this 10-year yield totally nosediving:

And the 30-year treasury bond is plummeting as well — investors are giving the Canadian government their money for 1.833%, when just four weeks ago it was 2.3%. A year ago it was a solid 100 bps higher. Investors are giving Ottawa their money for less than 2% for 30 years. The world has gone insane.
(Although if it makes you feel better, it’s even more insane over in Europe. I mean seriously, people are lending the government of France — FRANCE! — money for 10-years at 0.5%. What the heck?! But it’s sweet deal when you’re a primary dealer and can just buy total crap like French 10-year bonds and flip it to the ECB.)
Despite the Bank of Canada’s recent surprise rate cut, the Bank of Canada has been significantly slowing the rate of growth of its asset purchases in recent months, as I reported a few weeks ago.

At the same time, down south, the Federal Reserve — the central bank of our biggest trading partner — has ended QE3 and its balance sheet no longer showing any net growth.
I am not clear how the BoC’s recent rate cut will factor into this, nor am I clear what Yellen and the Fed will do if the US economy shows signs of panic (QE4?), but I think the inversion of our yield curve is related to all this. Remember, short-term rates are lowered by periods of central bank monetary expansion because they buy up debt at the short end of the curve with newly created money. All signs have pointed to the end or at least slow down of high monetary inflation by these central banks. Businessmen who thought all this investment in capital was justified because of distorted interest rates are getting a wake-up call. The truth is manifesting in the debt markets.
So watch the yield curve in Canada closely in the near future. If the 3-month rate goes above the 30-year rate, I’d say there is a 90% chance of recession within six months. If the inversion doesn’t go all the way out to the 30-year, then it may not indicate recession but it still suggests slower growth going forward.
January 7, 2015 1 Comment
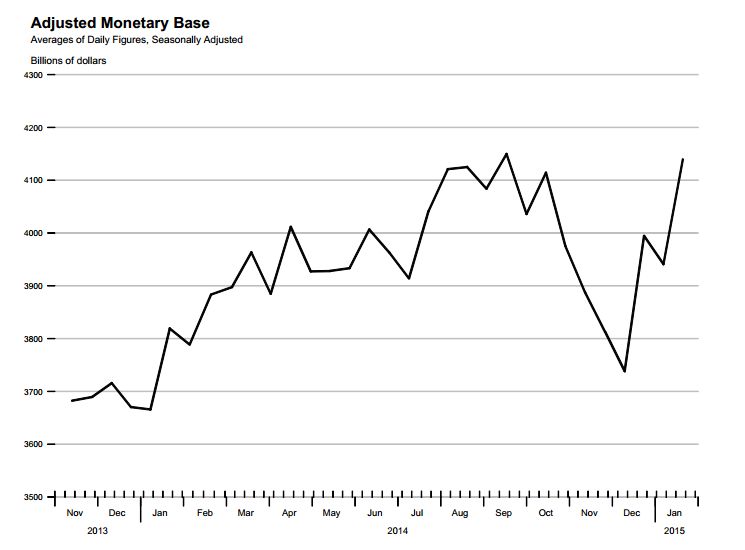
It looks like the Bank of Canada is slowing the growth of the monetary base.
The Bank of Canada has been printing money like crazy in the last few years, beating up the dollar to artificially juice up exports, which supposedly, according to Keynesian-mercantilists like Poloz, stimulates the economy. (It doesn’t — it just means Canadians have to sell more stuff to buy the same amount of imports, which actually makes the country poorer.)
So a slowdown, or flattening, of the BoC’s frenzied asset buying is definitely a good thing. Especially as the American dollar is strengthening considerably.
South of the border, the Fed looks like it might be reversing its recent deflationary actions, where it had sold off a surprising 10% of its assets.
 Maintaining the “boom” phase of the business cycle requires an ever-increasing rate of monetary expansion. So these actions will put huge strain on their respective economies.
It often takes about a year for the effects of monetary policy to really be felt throughout the system. If the stabilization path continues, then Canada will probably go into a recession later this year.
HAPPY NEW YEAR!
June 24, 2014 Leave a comment
The Bank of Canada’s balance sheet is now bigger than ever. The central bank grows fat on the debts created by Ottawa.

The rate of growth had slowed a bit in recent months, but the latest data tells us that Governor Poloz really doesn’t know what to do other than create new money and buy stuff. This is exasperating the business cycle and driving down the price of the Canadian dollar.
The Bank of Canada’s assets are 99% Canadian government bills and bonds. Buying more of these bids up their prices and pushes interest rates lower than they would be otherwise.
The newly created money enters the capital markets, and begins distorting the market’s allocation of resources. This is the cause of business cycles.
Interestingly, rates are so low in Canada that capital is nearly free, but the Eastern economy is still a mess. According to Keynesianism, the entire country should be on the verge of Utopia.
The aggressive monetary policy was kicked off by Carney, shortly after selling off the Bank’s emergency acquisitions of the financial crisis. Poloz is continuing this policy. He is trying to juice the Canadian economy by driving down the value of the Canadian dollar, thereby increasing exports, as he told us in his April 16 rate decision. This kind of short-sighted and special-interest-serving policy is to be expected from central bankers, particularly ones who worked Export Development Canada for more than a decade, like Poloz.
Hilariously, a few days ago the mainstream media churned out a puff piece about how Poloz is the “king” of central bankers and other central bankers want to be like him. The article presents Poloz as a really cool dude because when he says something, the Canadian dollar’s value is more greatly affected than the value of other currencies when their central bankers talk.
It never seems to occur to anyone that this is a horrible, horrible thing. It shows that the dollar is dangerously sensitive to the whims of central bankers, and that is not healthy for an economy. Uncertainty due to regulatory hazard is destructive to economic opportunity.
But of course, words are one thing, and the biggest impact on the economy emerges from the BoC’s actions — i.e. printing money. And as we can see, the Bank of Canada still going full steam ahead with that plan.
June 9, 2014 1 Comment
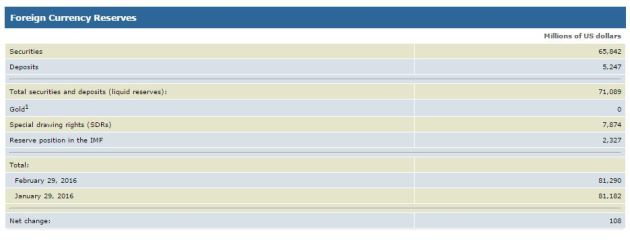
The Bank of Canada has somewhat arrested the rate of growth on its balance sheet. The monetary base has reached a bit of a “plateau” for now, very close to all-time highs from December 2013 ($91.045 billion on the books as of April 30 2014).
It seems Poloz is trying to follow along with the general “tapering” strategy of the Fed. In order to maintain the “boom” of this business cycle (as lame a boom as it might be), the balance sheet’s size must continue to trend higher. But the flattening of the curve means that the BoC’s purchases are slowing. This will tend to push down asset prices.

December 29, 2013 Leave a comment
Mainstream economists fail to see why crises occur.
October 3, 2013 Leave a comment
Frank Shostak, Mises Institute
Most economists surveyed by Bloomberg News are now of the view that the Federal Reserve will begin tapering asset purchases in December. Contrary to expectations on the 18-19 of September, Federal Reserve policymakers have decided to continue with a very loose monetary stance and postpone the tapering of asset purchases.
Most policymakers are of the view that the U.S. economy is not strong enough to generate self-sustained economic growth. Hence it is held the economy still requires support from the Fed.
If Fed policymakers were to decide to taper bond purchases, most experts are of the view Fed policymakers are likely to announce that the U.S. central bank is going to keep its near-zero interest rate policy for a prolonged period of time. This, it is held, should prevent negative side effects coming from the reduction in bond purchases.
For instance, in 1994 when the Fed started a tightening cycle the federal funds rate rose from 3.05 percent in January 1994 to 6.04 percent in April 1995. This, it is argued, caused a sharp fall in the pace of economic activity. The yearly rate of growth of industrial production fell from 7 percent in December 1994 to 2.7 percent by December 1995.


We suggest that it is changes in money supply rather than changes in interest rates that drive economic activity as such. Interest rates are just an indicator, as it were.
A fall in the growth momentum of industrial production during December 1994 to December 1995 occurred on account of a sharp decline in the yearly rate of growth of AMS (our measure of money supply) from 13.7 percent in September 1992 to minus 0.3 percent in April 1995.
This sharp fall in the growth momentum of AMS has weakened the support for various bubble activities that sprang up on the back of the previous rising growth momentum of AMS.
(Even if the Fed would have kept the fed funds rate at a very low level, what would have dictated the pace of economic activity is the growth momentum of AMS.)
Note that a fall in the growth momentum of AMS was in line with the fall in the growth momentum of the Fed’s balance sheet — the yearly rate of growth of the balance sheet fell from 12.7 percent in June 1993 to 4.4 percent by December 1995.


Whilst in the 1993 to 1995 period, changes in the Fed’s balance sheet were positively associated with changes in the growth momentum of money supply. This time around this is not the case. (Changes in money supply are not responding to changes in the Fed’s balance sheet.) The key reason for that is bank reluctance to aggressively expand lending notwithstanding the aggressive pumping by the Fed.
So far in September, the growth momentum of the Fed’s balance sheet climbed to 30.6 percent from 28 percent in August. (Despite this massive pumping banks remain reluctant to aggressively expand lending.) In September banks were sitting on massive cash reserves of $2.2 trillion against $2.17 trillion in August and $2.4 billion in January 2008.


Consequently, the growth momentum of our measure of money supply AMS has visibly weakened. The yearly rate of growth stood at in September at 6.7 percent against 7.7 percent in August.
We suggest that irrespective of what the Fed is currently doing it will have very little effect on the economy at present and in the immediate future. Given a decline in the yearly rate of growth of AMS from 14.8 percent in October 2011 to 6.7 percent in September this year, we suggest this likely to depress economic activity going forward.
Again, this is likely to happen irrespective of the decision the Fed is going to take with respect to the tapering of assets purchases.
Based on the lagged growth momentum of AMS we expect that the yearly rate of growth of industrial production to fall to minus 1 percent by October from 2.7 percent in August.


Given the possibility of a sharp decline in economic activity on account of the fall in the growth momentum of AMS it is quite likely that Fed policymakers will decide to postpone the tapering of asset purchases also in December.
We need to add to all of this the possibility that the pool of real wealth might be currently in difficulties on account of the Fed’s reckless policies.
(The near zero interest rate policy has caused a severe misallocation of scarce real savings — it has weakened the wealth generation process and thus the economy’s ability to support stronger real economic growth.)
If our assessment is valid on this, we can suggest that a stagnant or declining pool of real wealth is likely to put more pressure on banks’ lending. Remember that it is the state of the pool of real wealth that dictates banks’ ability to lend without going belly up.
Conclusion
We can conclude that regardless of changes in the Fed’s balance sheet, it is a fall in the growth momentum of AMS since October 2011 that will determine the pace of economic activity irrespective of the planned actions by the Fed. Given the possibility that the pool of real wealth might be in trouble this could put further pressure on the growth momentum of bank lending and thus the growth momentum of money supply.
October 2, 2013 Leave a comment
The Bank of Canada’s balance sheet shed about a billion dollars in August, but remains at record high levels.
Governor Poloz, like everyone else, is watching the Fed. With no taper in September (as we predicted), he is unlikely to do much to change BoC policy. To keep the Canadian dollar from appreciating too greatly against the US dollar, the BoC must maintain a level of quantitative easing consistent with the Fed’s own. Poloz is a mercantilist, and is therefore opposed to having a strong Canadian currency.

July 30, 2013 1 Comment
During the 2008 financial crisis, the Bank of Canada intervened with an unprecedented 50% expansion of its balance sheet to a total of nearly $80 billion. This was done by creating money and purchasing assets from the big banks in order to add liquidity to the market.
By mid-2010, they had unloaded these emergency acquisitions and their balance sheet returned to pre-crisis levels.
But now, after years of growth, the Bank of Canada’s balance sheet is bigger than ever. The BoC holds nearly $90 billion in assets.

But the crisis is over, isn’t it? The Bank of Canada is trying to keep the Canadian dollar down and interest rates low. They are acting like the crisis is not over, or like another crisis is waiting to emerge.
June 6, 2013 Leave a comment
Debate rages on about how sustainable or even real the economic recovery is in the US.
David Rosenberg, former chief economist at Merrill Lynch, showed a presentation at one of John Mauldin’s recent conferences. It is entitled: “The Fed Is Trying Like Crazy, But Nothing It Does Can Save The Economy.”
The presentation consists of 60 slides that collectively devastate the case for expecting serious economic recovery in the US. The charts are extremely convincing. The argument he builds with his evidence seems irrefutable.
You can see the entire presentation here. It is worth your time.
While Rosenberg is very bearish on the US, he seems optimistic about Canada. He thinks the “short Canada” trade is a huge mistake.
He draws his conclusion about Canada mostly by looking at 2013 Q1 data, but overall he underestimates Canada’s problems. Canada’s housing sector is more distorted by intervention than he realizes, and our employment data is terrible.
He also downplays the interventions of the Bank of Canada. He says Canada has performed better than the US “without nearly as much … expansion of the central bank balance sheet.”
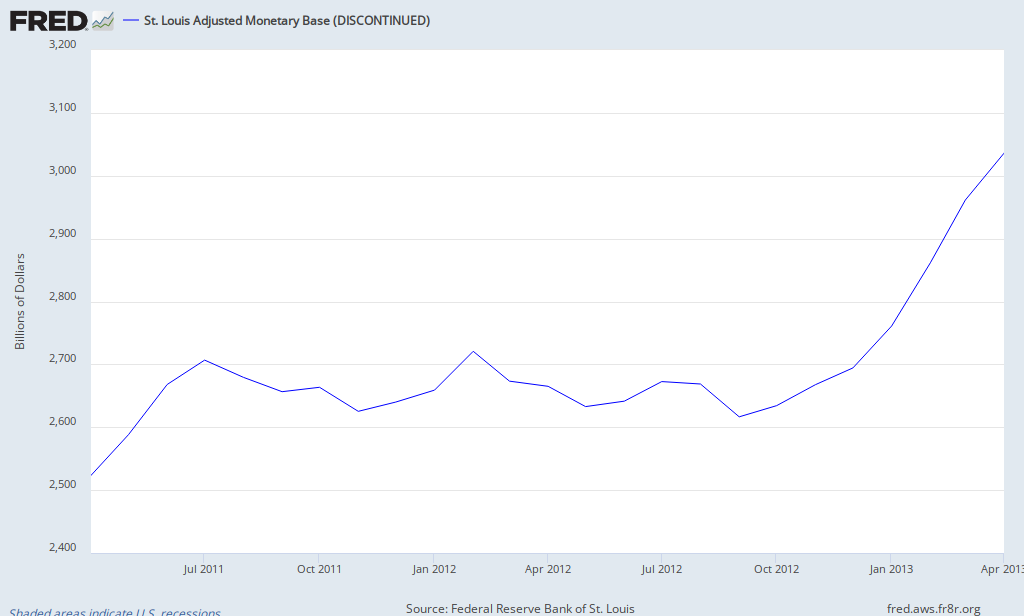
Is this actually true? The BoC deflated in the immediate aftermath of the financial crisis, but it has been busy making acquisitions in the last couple years. In two years, the BoC has expanded its balance sheet by about 30%, whereas the Fed has expanded by about 20% in the same time.
The Fed:
–
Here is the BoC monetary base (this chart uses data from here):
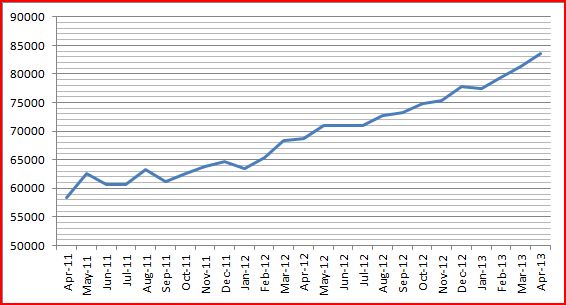
–
I think Rosenberg is right on the US and a bit off-base for Canada.
