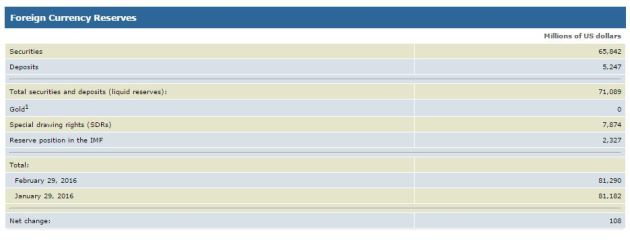
Canada Has Sold Off All Its Gold Reserves
March 3, 2016 Leave a comment
As of today, Canada has no more gold reserves.
This is a process that has been going on since the 1960s, when Canada had 1,000 tons of gold reserves.
Now they have zero.
Markets, Freedom, and Truth
March 3, 2016 Leave a comment
As of today, Canada has no more gold reserves.
This is a process that has been going on since the 1960s, when Canada had 1,000 tons of gold reserves.
Now they have zero.
July 25, 2013 2 Comments
The price of gold has been going through an anxious bottoming period and now seems resolutely back above $1300. But what’s next?
Look at the following chart:

–
Basically, this chart shows the difference between commercial long and short positions. The green dots are positioned at intermediate low-points in the price of gold, which are also points where commercial net longs are at relative highs. This is no coincidence. The commercials are major players in the market. They hedge against price fluctuations rather than speculate. They reduce their short positions near significant price bottoms. If you could go back in time, the green dots would be your buy signals. This chart shows commercial short positions at the lowest point in a very long time — more than ten years. Where do you think the newest green dot will appear?
Now look at this chart, which is a little different.

–
This also illustrates how the falling price and increase in commercial long positions generally foreshadows a meaningful rally for gold. If I were to judge from this chart, I’d say we should expect a significant expansion of commercial longs. The price of gold should correspondingly rise. Here, the red dots are the buy signals. Where do you think the newest red dot would go?
As a conservative estimate, if we saw a rally comparable 2005 and 2008’s moves, the next phase of the gold bull market would approach $2000/oz.
This process is likely to unfold as the current business cycle matures, over the next one or two years Then when another panic hits, gold will sell-off until central banks accelerate their monetary interventions. They will do this to fight the onset of a crushing economic depression.
— Read more at King World News —
June 17, 2013 Leave a comment
You have to see these images from China.
During the Dragon Boat Festival, ten thousand Chinese demonstrated the depth of their gold fever by lining up to buy that “stupid” investment. This is despite the relative respite from inflation, according to official Chinese statistics.
All these people want gold:

–

–

–

–

–

–
China is a source of demand for gold that will be significant in the long term.
— Read more at Mises.ca —
May 2, 2013 Leave a comment
Owning stocks in the junior mining sector is like holding a stick of soggy dynamite. With a good trade, your portfolio gets a growth explosion. With a bad trade, you explode.
These shares have taken a beating in 2013, creating huge opportunities for value. Insiders have no compunctions about scooping up shares at these low prices.
The INK Research Venture indicator was at 715% on April 30. This means that in the past 60 days, more than seven stocks on the TSX:V have insider buying for every stock with insider selling. Historically, this tends to foreshadow a rally in those prices.
In early March, this indicator was ‘only’ at 400%, so there has been a large increase. The current number is very close to its all time peak of 735% back on October 27, 2008. This preceded the bottoming-out of the Venture market in December 2008 by about six weeks. You may recall how that was a time when many people thought the world was going to end.
But wait. There is also a shorter-term 30-day Venture indicator. It hit 1229% on April 30.
Then there is the INK Gold Stock Indicator. This tracks insider buying on Canadian-listed gold stocks. There are more than 10 stocks with insider buying for every stock with insider selling. This indicator hit an all-time high of 1046% on April 26.
To be a successful investor, you have to be gutsy and buy when prices are low. Maybe insider buying patterns give some encouragement to acquire more soggy dynamite for your portfolio.
— Read more in INK’s report —
April 15, 2013 Leave a comment
Last week gold and silver got killed, especially after the rumor hit that Cyprus would sell gold to get a big fat bailout (honestly I doubt that will happen).
The slaughter continued today. I am writing this with gold at $1365. Margin calls are probably dropping left and right.
Other commodities have fallen, including oil. Bonds have rallied recently. The 30-year Treasury offers less than 3%, which is pretty much completely crazy. Meanwhile, Canada lost 54,000 jobs in March — the worst employment update in four years.
To me, these are pieces of data which imply an economic correction trying to work itself out, rather than a rippin’ recovery. If these developments justify concerns about a slowing economy, then you want to be careful about the mainstream coverage about this gold panic, and their general frenzy about buying stocks.
US stocks, which are the hot ticket these days, seem to me dangerously high. Corporate earnings in the US are 70% above their historical average due to massive fiscal profligacy by government and citizenry, and aggressive cost-cutting post-2008. Periods of strong corporate profits are never permanent and eventually regress towards the mean. Therefore it should be expected that future earnings and dividends will disappoint.

The Fed is struggling to perpetuate the error cycle and keep the ‘recovery’ going.

Meanwhile, the TSX is not performing well this year, after being one of the world’s worst stock markets in 2012. And the TSX-V — which is where all the most exciting action is — is going to get smaller. The average level of cash held by TSX-V-listed stocks has fallen from $4.3 million in mid-2011 to about $2.8 million now. This might not sound too bad because it is still several times higher than pre-2008 levels, but on a per-share basis, it is terrible. TSX-V companies have only about 2.8 cents per share as of last quarter, a drop of more than 50% in two years. Remember, these companies don’t usually generate their own cash flows from any operations, and cash is frequently their only good asset. All the while, TSX-V companies have doubled their liabilities per share — so when the nearly 2.6 cents per share is paid off, they are basically broke. So while this says nothing about any individual companies, it suggests the junior resource sector is going to come up on some hard times.
I absolutely expect Canada and the US to join the other developed nations suffering from recession.
If you hold stocks at this time, you should seriously think about just selling most or all of them. Be ruthless about keeping only the absolute best ones. Keep the balance in cash and patiently await buying opportunities as prices fall.
If you are a long-term believer in gold, this is clearly a huge buying opportunity. Gold could still fall another 10-15% before hitting a bottom, and it could take a 6-12 months to recover. I would like to point out that during the previous gold market, there was a 20% price drop in late 1978. We know how that turned out. Yet, if the fundamental argument for gold is still sound, then today’s prices are a godsend.
