What’s Going on with the Bank of Canada’s Assets?

It looks like the Bank of Canada is slowing the growth of the monetary base.

The Bank of Canada has been printing money like crazy in the last few years, beating up the dollar to artificially juice up exports, which supposedly, according to Keynesian-mercantilists like Poloz, stimulates the economy. (It doesn’t — it just means Canadians have to sell more stuff to buy the same amount of imports, which actually makes the country poorer.)

So a slowdown, or flattening, of the BoC’s frenzied asset buying is definitely a good thing. Especially as the American dollar is strengthening considerably.

South of the border, the Fed looks like it might be reversing its recent deflationary actions, where it had sold off a surprising 10% of its assets.

fed deflationMaintaining the “boom” phase of the business cycle requires an ever-increasing rate of monetary expansion. So these actions will put huge strain on their respective economies.

It often takes about a year for the effects of monetary policy to really be felt throughout the system. If the stabilization path continues, then Canada will probably go into a recession later this year.

HAPPY NEW YEAR!


Advertisement

The Central Planning Gambit: Can Central Banks Avoid a Crash?

The Bank for International Settlements put out its annual report on June 29. It says that the recovery is driven primarily by new fiat money generated by central banks. As a result, the pricing of capital assets is badly distorted. The overall theme is Austrian, not Keynesian.

Here is the summary:

A new policy compass is needed to help the global economy step out of the shadow of the Great Financial Crisis. This will involve adjustments to the current policy mix and to policy frameworks with the aim of restoring sustainable and balanced economic growth.

The global economy has shown encouraging signs over the past year but it has not shaken off its post-crisis malaise. Despite an aggressive and broad-based search for yield, with volatility and credit spreads sinking towards historical lows, and unusually accommodative monetary conditions, investment remains weak. Debt, both private and public, continues to rise while productivity growth has extended further its long-term downward trend. There is even talk of secular stagnation. Some banks have rebuilt capital and adjusted their business models, while others have more work to do.

To return to sustainable and balanced growth, policies need to go beyond their traditional focus on the business cycle and take a longer-term perspective — one in which the financial cycle takes centre stage. They need to address head-on the structural deficiencies and resource misallocations masked by strong financial booms and revealed only in the subsequent busts. The only source of lasting prosperity is a stronger supply side. It is essential to move away from debt as the main engine of growth.

Resources have been grossly misallocated by these interventions. Chapter VI begins with the following observations:

Nearly six years after the apex of the financial crisis, the financial sector is still coping with its aftermath. Financial firms find themselves at a crossroads. Shifting attitudes towards risk in the choice of business models will influence the sector’s future profile. The speed of adjustment will be key to the financial sector again becoming a facilitator of economic growth.

The banking sector has made progress in healing its wounds, but balance sheet repair is incomplete. Even though the sector has strengthened its aggregate capital position with retained earnings, progress has not been uniform. Sustainable profitability will thus be critical to completing the job. Accordingly, many banks have adopted more conservative business models promising greater earnings stability and have partly withdrawn from capital market activities.

Looking forward, high indebtedness is the main source of banks’ vulnerability. Banks that have failed to adjust post-crisis face lingering balance sheet weaknesses from direct exposure to overindebted borrowers and the drag of debt overhang on economic recovery (Chapters III and IV). The situation is most acute in Europe, but banks there have stepped up efforts in the past year. Banks in economies less affected by the crisis but at a late financial boom phase must prepare for a slowdown and for dealing with higher non-performing assets.

Then it discusses commercial banks — they are relying on the low interest rate environment to keep submarginal borrowers afloat. This is postponing inevitable losses.

In the United States, non-performing loans tell a different story. After 2009, the country’s banking sector posted steady declines in theaggregate NPL ratio, which fell below 4% at end-2013. Coupled with robust asset growth, this suggests that the sector has madesubstantial progress in putting the crisis behind it. Persistent strains on mortgage borrowers, however, kept the NPL ratios of the two largest government-sponsored enterprises above 7% in 2013.Enforcing balance sheet repair is an important policy challenge in the euro area. The challenge has been complicated by a prolonged period of ultra-low interest rates. To the extent that low rates support wide interest margins, they provide useful respite for poorly performing banks. However, low rates also reduce the cost of – and thus encourage – forbearance, ie keeping effectively insolvent borrowers afloat in order to postpone the recognition of losses. The experience of Japan in the 1990s showed that protracted forbearance not only destabilises the banking sector directly but also acts as a drag on the supply of credit and leads to its misallocation (Chapter III). This underscores the value of the ECB’s asset quality review, which aims to expedite balance sheet repair, thus forming the basis of credible stress tests.

The holy grail of central banking is this: shrink asset bubbles without crashing the economy.

No central bank has ever accomplished this. Yet monetary central planners have big egos — they think they are the smartest people in the entire universe. Right now, they think they have the economy under their control — unemployment slowly falling, economic activity slowly improving, and consumer price inflation is nowhere in sight.

Business cycle “recovery” phases (even weak ones) can’t last forever. The question is, can they pull off their ultimate gambit?

If central banks can unwind the massive increases to their balance sheets without causing recessions, it will show that Keynesian economics works. It will be nothing short of a miracle.

Do you believe in miracles?

Bank of Canada Has More Assets Than Ever

The Bank of Canada’s balance sheet is now bigger than ever. The central bank grows fat on the debts created by Ottawa.

boc may14

The rate of growth had slowed a bit in recent months, but the latest data tells us that Governor Poloz really doesn’t know what to do other than create new money and buy stuff. This is exasperating the business cycle and driving down the price of the Canadian dollar.

The Bank of Canada’s assets are 99% Canadian government bills and bonds. Buying more of these bids up their prices and pushes interest rates lower than they would be otherwise.

The newly created money enters the capital markets, and begins distorting the market’s allocation of resources. This is the cause of business cycles.

Interestingly, rates are so low in Canada that capital is nearly free, but the Eastern economy is still a mess. According to Keynesianism, the entire country should be on the verge of Utopia.

The aggressive monetary policy was kicked off by Carney, shortly after selling off the Bank’s emergency acquisitions of the financial crisis. Poloz is continuing this policy. He is trying to juice the Canadian economy by driving down the value of the Canadian dollar, thereby increasing exports, as he told us in his April 16 rate decision. This kind of short-sighted and special-interest-serving policy is to be expected from central bankers, particularly ones who worked Export Development Canada for more than a decade, like Poloz.

Hilariously, a few days ago the mainstream media churned out a puff piece about how Poloz is the “king” of central bankers and other central bankers want to be like him. The article presents Poloz as a really cool dude because when he says something, the Canadian dollar’s value is more greatly affected than the value of other currencies when their central bankers talk.

It never seems to occur to anyone that this is a horrible, horrible thing. It shows that the dollar is dangerously sensitive to the whims of central bankers, and that is not healthy for an economy. Uncertainty due to regulatory hazard is destructive to economic opportunity.

But of course, words are one thing, and the biggest impact on the economy emerges from the BoC’s actions — i.e. printing money. And as we can see, the Bank of Canada still going full steam ahead with that plan.

Bank of Canada’s Balance Sheet: Still Trending Higher

The Bank of Canada has somewhat arrested the rate of growth on its balance sheet. The monetary base has reached a bit of a “plateau” for now, very close to all-time highs from December 2013 ($91.045 billion on the books as of April 30 2014).

It seems Poloz is trying to follow along with the general “tapering” strategy of the Fed. In order to maintain the “boom” of this business cycle (as lame a boom as it might be), the balance sheet’s size must continue to trend higher. But the flattening of the curve means that the BoC’s purchases are slowing. This will tend to push down asset prices.

boc april14

Is the Taper a Big Lie?

(NOTE TO READER: There was a considerable time lag between the beginning of the QE3 taper’s declared beginning and when it actually started. This article was written during the lag, suggesting that the taper was all hype and no reality. Since then, the taper did become real and QE3 ended.)

The much-talked-about taper could be nothing more than a big joke. Where is the statistical evidence of the taper?

Let’s look at the last 10 years of the Federal Reserve’s balance sheet.

taper1

Here you can see all three QEs laid out nicely.

Let’s “zoom in” and look at just the last year.

taper2

The rate of growth briefly slowed then picked right back up. Other purchases appear to be offsetting the taper, at least so far. On net, no taper. Watch what they do, don’t fret too much over what they say (central bankers lie all the time).

Meanwhile, despite media reports and promises from European central bankers that they will inflate to prevent recession, the ECB is engaged in a deflationary policy, and has been for nearly a year.

Sometimes the official central bank statistics don’t match their words.

The Fed has been saying it will not let interest rates rise, yet at the same time it will slow its rate of purchasing assets. I don’t know how that is supposed to work, since regardless of the Federal Funds target rate, the market sets the real Federal Funds rate. Yet it almost makes sense if you assume while they might buy less crap via QE3, they will balance that with more purchases of different crap.

Why They Never See It Coming

Mainstream economists fail to see why crises occur.

Fed Could Delay Tapering Until After December

Frank Shostak, Mises Institute

Most economists surveyed by Bloomberg News are now of the view that the Federal Reserve will begin tapering asset purchases in December. Contrary to expectations on the 18-19 of September, Federal Reserve policymakers have decided to continue with a very loose monetary stance and postpone the tapering of asset purchases.

Most policymakers are of the view that the U.S. economy is not strong enough to generate self-sustained economic growth. Hence it is held the economy still requires support from the Fed.

If Fed policymakers were to decide to taper bond purchases, most experts are of the view Fed policymakers are likely to announce that the U.S. central bank is going to keep its near-zero interest rate policy for a prolonged period of time. This, it is held, should prevent negative side effects coming from the reduction in bond purchases.

For instance, in 1994 when the Fed started a tightening cycle the federal funds rate rose from 3.05 percent in January 1994 to 6.04 percent in April 1995. This, it is argued, caused a sharp fall in the pace of economic activity. The yearly rate of growth of industrial production fell from 7 percent in December 1994 to 2.7 percent by December 1995.


We suggest that it is changes in money supply rather than changes in interest rates that drive economic activity as such. Interest rates are just an indicator, as it were.

A fall in the growth momentum of industrial production during December 1994 to December 1995 occurred on account of a sharp decline in the yearly rate of growth of AMS (our measure of money supply) from 13.7 percent in September 1992 to minus 0.3 percent in April 1995.

This sharp fall in the growth momentum of AMS has weakened the support for various bubble activities that sprang up on the back of the previous rising growth momentum of AMS.

(Even if the Fed would have kept the fed funds rate at a very low level, what would have dictated the pace of economic activity is the growth momentum of AMS.)

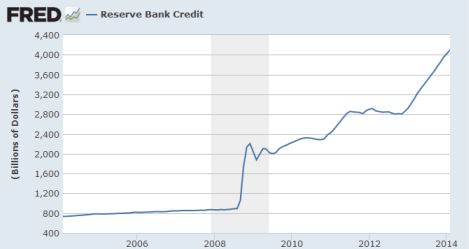
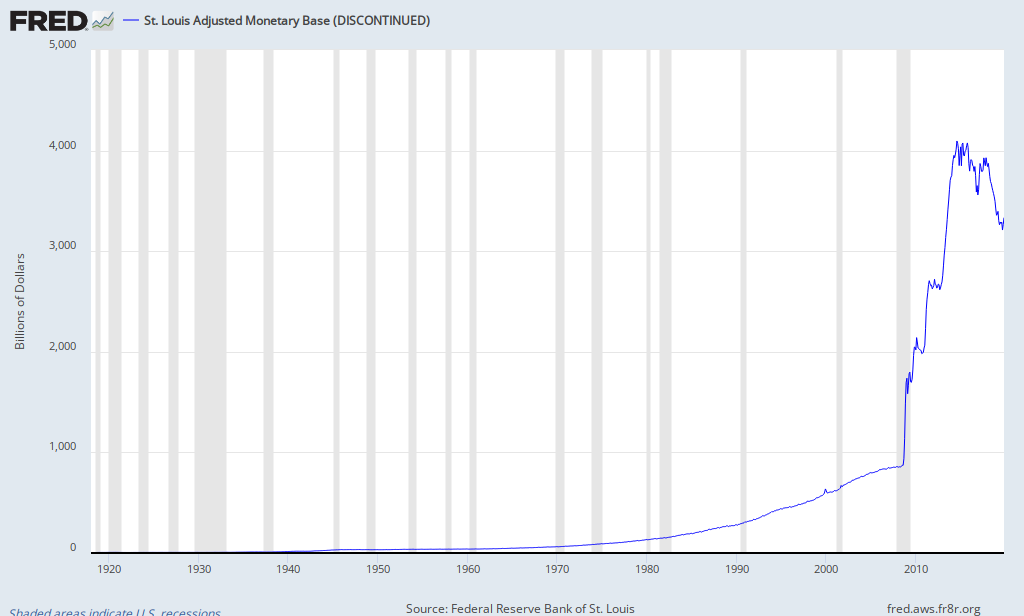
Note that a fall in the growth momentum of AMS was in line with the fall in the growth momentum of the Fed’s balance sheet — the yearly rate of growth of the balance sheet fell from 12.7 percent in June 1993 to 4.4 percent by December 1995.


Whilst in the 1993 to 1995 period, changes in the Fed’s balance sheet were positively associated with changes in the growth momentum of money supply. This time around this is not the case. (Changes in money supply are not responding to changes in the Fed’s balance sheet.) The key reason for that is bank reluctance to aggressively expand lending notwithstanding the aggressive pumping by the Fed.

So far in September, the growth momentum of the Fed’s balance sheet climbed to 30.6 percent from 28 percent in August. (Despite this massive pumping banks remain reluctant to aggressively expand lending.) In September banks were sitting on massive cash reserves of $2.2 trillion against $2.17 trillion in August and $2.4 billion in January 2008.


Consequently, the growth momentum of our measure of money supply AMS has visibly weakened. The yearly rate of growth stood at in September at 6.7 percent against 7.7 percent in August.

We suggest that irrespective of what the Fed is currently doing it will have very little effect on the economy at present and in the immediate future. Given a decline in the yearly rate of growth of AMS from 14.8 percent in October 2011 to 6.7 percent in September this year, we suggest this likely to depress economic activity going forward.

Again, this is likely to happen irrespective of the decision the Fed is going to take with respect to the tapering of assets purchases.

Based on the lagged growth momentum of AMS we expect that the yearly rate of growth of industrial production to fall to minus 1 percent by October from 2.7 percent in August.


Given the possibility of a sharp decline in economic activity on account of the fall in the growth momentum of AMS it is quite likely that Fed policymakers will decide to postpone the tapering of asset purchases also in December.

We need to add to all of this the possibility that the pool of real wealth might be currently in difficulties on account of the Fed’s reckless policies.

(The near zero interest rate policy has caused a severe misallocation of scarce real savings — it has weakened the wealth generation process and thus the economy’s ability to support stronger real economic growth.)

If our assessment is valid on this, we can suggest that a stagnant or declining pool of real wealth is likely to put more pressure on banks’ lending. Remember that it is the state of the pool of real wealth that dictates banks’ ability to lend without going belly up.

Conclusion

We can conclude that regardless of changes in the Fed’s balance sheet, it is a fall in the growth momentum of AMS since October 2011 that will determine the pace of economic activity irrespective of the planned actions by the Fed. Given the possibility that the pool of real wealth might be in trouble this could put further pressure on the growth momentum of bank lending and thus the growth momentum of money supply.

Bank of Canada’s Balance Sheet Continues to Swell

The Bank of Canada’s balance sheet shed about a billion dollars in August, but remains at record high levels.

Governor Poloz, like everyone else, is watching the Fed. With no taper in September (as we predicted), he is unlikely to do much to change BoC policy. To keep the Canadian dollar from appreciating too greatly against the US dollar, the BoC must maintain a level of quantitative easing consistent with the Fed’s own. Poloz is a mercantilist, and is therefore opposed to having a strong Canadian currency.

BoC as of October

Capital Is Flowing Out of the U.S. Faster Than Ever

The US Treasury Department reports that Japan and China — the biggest holders of America’s debt by far — has dumped $40.8 billion in US bonds.

Interestingly, government bonds were not the only products being sold. Foreigners sold:

  • $5.2 billion in Freddie Mac, Fannie Mae, and Ginnie Mae bonds.
  • $5 billion in corporate bonds
  • $116 million in bonds composed of packaged US mortgages.

And they also sold $26.8 billion in US stocks.

All counted, this withdrawal of foreign capital is greater than during the 2008 crisis. It is greater than any time in history.

The Fed’s QE3 program, which creates $85 billion per month to suppress interest rates, is rapidly losing its effectiveness.

It prompts the worrying question: How big is QE4 going to be?

Read more at Money and Markets

Fed Discontinues “Excess Reserves” Chart

The St. Louis Federal Reserve Bank will no longer publish the chart showing excess reserves of commercial banks.

I can say little about why this decision was made. I suspect the Fed wants to draw minimal attention to the fact that most QE money goes into excess reserves.

The charts unequivocally show that the increase in excess reserves has corresponded almost exactly to the increase in the Fed’s monetary base. Observe:

MONETARY BASE

FRED Graph

EXCESS RESERVES

Graph of Excess Reserves of Depository Institutions

Why is this important? It shows to what extent the Fed’s different batches of QE are stockpiled by the commercial banks rather than pumped into the economy in the forms of loans.

When the Fed increases its balance sheet, the general rule is that the money will cause the money supply to increase because of fractional reserve banking.

However, after in the 2008 crisis, the M1 Multiplier tanked, meaning that each dollar added to the monetary base added much less to the money supply (M1). 

Graph of M1 Money Multiplier

The Fed has expanded its monetary base dramatically, but the M1 Multiplier makes us wonder where all that money went. The excess reserves chart shows us where most of the QE money goes.

As QE continues, we will have to assume excess reserves are rising if the M1 Multiplier remains extremely low. If the multiplier begins to rise, then more new money is entering the economy, not being added excess reserves. If M1 begins to skyrocket, then that means excess reserves are being loaned out.

— No more excess reserves charts — 


%d bloggers like this: