Canada Has Sold Off All Its Gold Reserves
March 3, 2016 Leave a comment
As of today, Canada has no more gold reserves.
This is a process that has been going on since the 1960s, when Canada had 1,000 tons of gold reserves.
Now they have zero.
Markets, Freedom, and Truth
March 3, 2016 Leave a comment
As of today, Canada has no more gold reserves.
This is a process that has been going on since the 1960s, when Canada had 1,000 tons of gold reserves.
Now they have zero.
January 31, 2015 Leave a comment
The yield curve in Canada shows signs of inverting. We need to watch this carefully as it is a strong indicator that we are heading towards a recession.
This week the rate on 3-month Canadian t-bills went higher than all the other rates out to the 5-year bond.
Here’s why this is important:
The yield curve is a graphical representation of the interest rates for debt instruments over different maturity dates. It normally looks something like this:

Economic actors prefer present goods to future goods, so future goods can only be exchanged for present goods at a discount. This gives rise to the phenomenon of interest (hence the term “discount rate” in finance when determining the present value of future cash flows).
The normal yield curve shows that the farther out in time you go for the maturity date, the higher the interest rate. There are two basic reasons. First, there is the issue of inflation, and lenders must take into account the depreciation of the monetary unit over time. Because the money supply is always expanding, the purchasing power of money tends to fall over time. Money paid back in the future is worth less with each passing year.
The second reason for the normal yield curve shape is that the default risk increases over time. The risk of default might be quite low over one year. But over ten years? Twenty years? Uncertainty is greater over that time period. The longer the debt takes to mature, the more one is subject to default risk, and so lenders compensate for this by demanding a higher rate of return.
This explains the shape of the normal yield curve. But there are unusual situations where the yield curve inverts — the short maturity end of the curve has a higher rate than longer-term debt. This is not normal, for reasons that should be obvious in light of the preceding discussion.
Putting aside the yield on the 1-month t-bill, we can usually assume that if the 3-month t-bill has a higher rate than the 30-year bond, the economy is going into a recession.
This implies a short-term liquidity crunch. Borrowers are starting to panic over their misguided investments due to artificially low short-term rates. They see impending losses. They will pay more for a 90-day loan than for a locked-in 5-year loan.
Meanwhile, the lenders are growing fearful about the short-term state of the economy as well. A recession pushes interest rates lower because the economy is weaker. Lenders are willing to give up the inflation premium they normally require. They nail down today’s higher long-term rates by purchasing more long-term bonds — which raises their price, and pushes down the rate.
Remember, when central banks are expanding the money supply, they buy up short-term t-bills to bid up their prices and push down their yields. The monetary expansion misallocates capital — investors and businessmen put more money into projects than the “real” economy can support, hence the “boom” phase preceding the “bust.” An inverted yield curve — rising short-term rates — signifies a liquidity shortage. Money is desperately needed right now to sustain capital projects.
(A detailed scholarly treatment of this issue can be found here — it’s a Ph.D dissertation, so it’s interesting albeit kind of dull).
So the inversion of the yield curve normally signals a recession. However, the yield curve is not fully inverted. The 3-month bill’s rate is still less than the 10- and 30-year bond rate. But these longer-term rates are plummeting rapidly.
Look at this 10-year yield totally nosediving:

And the 30-year treasury bond is plummeting as well — investors are giving the Canadian government their money for 1.833%, when just four weeks ago it was 2.3%. A year ago it was a solid 100 bps higher. Investors are giving Ottawa their money for less than 2% for 30 years. The world has gone insane.
(Although if it makes you feel better, it’s even more insane over in Europe. I mean seriously, people are lending the government of France — FRANCE! — money for 10-years at 0.5%. What the heck?! But it’s sweet deal when you’re a primary dealer and can just buy total crap like French 10-year bonds and flip it to the ECB.)
Despite the Bank of Canada’s recent surprise rate cut, the Bank of Canada has been significantly slowing the rate of growth of its asset purchases in recent months, as I reported a few weeks ago.

At the same time, down south, the Federal Reserve — the central bank of our biggest trading partner — has ended QE3 and its balance sheet no longer showing any net growth.
I am not clear how the BoC’s recent rate cut will factor into this, nor am I clear what Yellen and the Fed will do if the US economy shows signs of panic (QE4?), but I think the inversion of our yield curve is related to all this. Remember, short-term rates are lowered by periods of central bank monetary expansion because they buy up debt at the short end of the curve with newly created money. All signs have pointed to the end or at least slow down of high monetary inflation by these central banks. Businessmen who thought all this investment in capital was justified because of distorted interest rates are getting a wake-up call. The truth is manifesting in the debt markets.
So watch the yield curve in Canada closely in the near future. If the 3-month rate goes above the 30-year rate, I’d say there is a 90% chance of recession within six months. If the inversion doesn’t go all the way out to the 30-year, then it may not indicate recession but it still suggests slower growth going forward.
January 16, 2015 2 Comments
A large number of people have been asking me about the price of oil and what it means for the economy. Rather than just repeating myself all the time, I am writing this article.
SOME CLARIFICATIONS
I feel it is important to clarify how the law of supply and demand works, because I hear a lot of incorrect analysis from people who should know better. If you understand the law of supply and demand, I recommend that you skip to the next section.
Consider the following statement: “The price of oil is falling, and this is increasing the demand for oil — this will push the price of oil back up!”
This proposition is completely wrong.
Let me show you an ordinary supply and demand graph, like anything you will see in an introductory economics textbook.
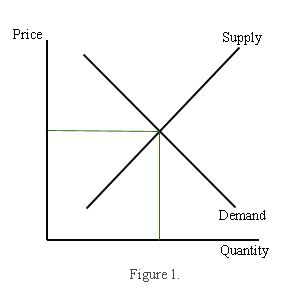
The x-axis is quantity, and the y-axis is price. The intersection of the demand curve and the supply curve is where the market clears — everyone can buy the amount they want to buy, and everyone can sell the amount they want to sell. Simple enough.
Now consider the following graph, which depicts a change in demand. Specifically, it shows an increase — the demand curve shifts to the right (D1 to D2).

What is happening here? Demand has increased, and the price goes up. What is not happening here? The increase was not caused by a lower price — instead, it caused an increase in the price. The rise in demand is the cause, the rise in price is the effect.
We know for a fact that the price of oil has fallen dramatically in the second half of 2014. Why? Reduced demand, increased supply, or both?
Much of the world is in economic trouble. China is slowing. Japan is a mess. Europe is a disaster. When much of the world is in recession or heading for recession, we expect the demand for oil to fall. And even in the US, where the economy is stronger, oil consumption has fallen 8% since 2010 (there are many reasons for this, but I will not go into it here). So falling demand is a reasonable explanation for the fall in oil prices.
There is also the issue of increasing supply. OPEC is still pumping, business as usual, even though the price is down. Shale oil producers have been producing in a frenzy. There is a greater supply of oil.
Here’s what it looks like:

The graph shows an increase in supply (the supply curve has shifted to the right). The market clears at a lower price. Less supply (S1) has become more supply (S2). The quantity demanded goes from Q1 to Q2.
The price of oil has been falling in the second half of 2014. It fell very fast. Supplies have not increased much since June. This makes me believe that falling demand is the primary cause in this situation.
Now let’s look at a situation where there is “inelastic” supply (meaning it is not very responsive to price) and a fall in demand.

This is an extremely “non-price-sensitive” supply. The Saudi head of oil production has proclaimed that they will keep pumping even if the price drops to $20 a barrel. The other producers need money, so they will keep pumping. They cannot trim production and influence the price. The Saudis have considerable influence in on the supply-side of the market. That’s why the supply is inelastic.
Let’s return to the initial proposition we considered: the oil price is lower, so there will be increased demand for oil. This is bad analysis. Part of the problem is in the fact that “demand” and “quantity demanded” are often used interchangeably. But essentially it is mixing up the issue in the first and second graphs.
The price of oil is down. The supply has increased. The demand has not increased — the quantity demanded at the new price is greater than at the higher price. This is not the same as saying a lower price of oil will increase the demand for oil. An increase in demand would — in the language of economics — imply a rightward shift of the entire demand curve.
A falling price does not increase demand, it increased quantity demanded. These things sound similar, but they are analytically different and this is important to understand at an elementary level.
Now with that boring stuff out of the way, let us look at the current situation with the price of oil and the economy.
SHALLOW CONSPIRACY THEORIES
I regularly speak with a lot of presidents and CEOs in the Alberta oil industry. A commonplace view is that price collapse is all the result of the Saudis pushing down the price of oil because [insert reasons here].
There are some amusing conspiracy theories floating around as well, particularly that which avers the US and its Saudi allies are manipulating the oil price to drive down the price of oil to hurt some evil countries, like Russia (America’s archenemy) and Iran (Saudi Arabia’s archenemy).
(I want to quickly point out that this is perhaps the only time in my entire life where people have complained about oil market manipulation driving the price… DOWN! Usually it’s greedy capitalists or crooked OPEC producers manipulating the market to drive the price UP to rip everyone off. But I digress.)
Realistically, how much of the blame rests on the Saudis? Maybe some, sure. But I don’t think it’s that much.
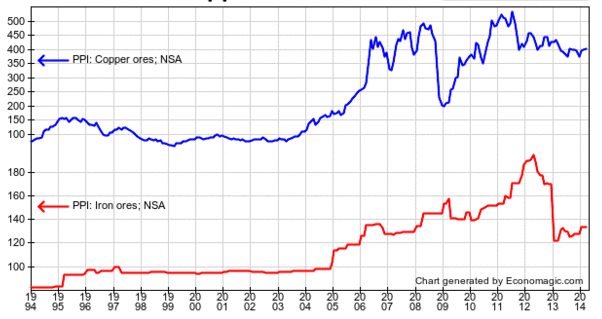
After all, how much does Saudi Arabia have to do with the price of steel, coal, and iron ore?

How much do the Saudis influence the price of copper (which, by the way, is almost as much of a barometer for the world economy as oil)?
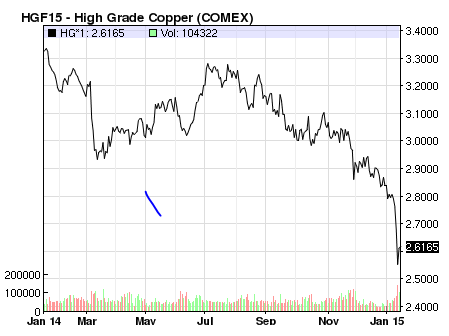
COMMODITY COLLAPSE
We see that oil is not the only commodity with a collapsing price. Maybe instead of market manipulation, it’s a sign that the global economy is not as strong as everyone had hoped.
The phony economic boom of the last two decades is slowing down, exposing what the Austrian business cycle theory refers to as “malinvestment.”
The distortion in commodity prices are the result of central banks collectively expanding their balance sheets from $5 trillion to $16 trillion in the last 10 years.
We also need to think about think about China, which has driven a great deal of the marginal demand for commodities in the last several cycles.
China’s radical growth levels were not going to last forever, and investors should have known better. But I guess that’s why they call it a “mania” and “irrational exuberance.”
China went from $1 trillion GDP to $9 trillion GDP in 13 years — an insane growth level that would be impossible but for printing press finance.
The incredible Keynesian-mercantilism started by Deng in the early 90s resulted in China’s demand for oil quadrupling from 3 million barrels per day to 12 million per day. Before then, the $20 price for a barrel of oil was, all things considered, was pretty much the same as it was 100 years when adjusted for inflation. Which makes sense given the basic balance of harder-to-get oil and improving technological methods over time.

The story is the same elsewhere. In the crackup boom phase of the cycle, iron ore prices hit 9x their historic range at the peak, and copper prices hit 5x their historic range.
As with the other industrial commodities, there has been massive investment in petroleum production to feed the world’s unsustainable growth projections. Huge scale undertakings in the Canadian oil sands, US shale, and various deep-sea drilling projects, driven by these consumption forecasts and cheap credit, have resulted in major production increases. The bubble finance hype machine over the “Fracking revolution” in US shale led to a 4x increase in oil production with wells that would be uneconomical in a sane world.
So now there is too much oil production and not enough demand. The market needs to normalize, and that means the price of oil (and other commodities) needs to fall so sanity can be restored.
US shale in particular is a nasty bubble — the next “subprime” crisis.
North Dakota needs an oil price of around $55 per barrel at the wellhead and a fleet of about 140 rigs to sustain production at the current level of 1.2 million barrels per day, the U.S. state’s chief regulator told legislators on Thursday. . . . Breakeven rates for new wells, the level at which all drilling would cease, range from $29 in Dunn county and $30 in McKenzie to $36 in Williams and $41 in Mountrail. These four counties account for 90 percent of the drilling in the state.
Breakevens in counties on the periphery of the Bakken play, which have far fewer rigs, range up to $52 in Renville-Bottineau, $62 in Burke and $73 in Divide.
But Flint Hills Resources’ posted price for North Dakota crude was just $32, Helms said, compared with almost $49 per barrel for WTI. Wellhead prices, which are roughly an average of the two, are around $40 and have been falling since the start of this year.
Even before prices hit these minimum levels, drilling will slow sharply. The number of rigs operating in the state has already fallen to 165, down from 191 in October, according to the department. . . .
To keep output steady at 1.2 million b/d for the next three years, the state’s producers need a price of $55 rising closer to $65 in the longer term to support a fleet of 140-155 rigs.
Helms’ projections confirm North Dakota’s oil output will start to fall by the end of the year unless prices rise from their current very depressed level.
Unlike conventional projects, shale wells enjoy an extremely short life. In the Bakken region straddling Montana and North Dakota, a well that starts out pumping 1,000 barrels a day will decline to just 280 barrels by the start of year two, a shrinkage of 72%. By the beginning of year three, more than half the reserves of that well will be depleted, and annual production will fall to a trickle. To generate constant or increasing revenue, producers need to constantly drill new wells, since their existing wells span a mere half-life by industry standards.
In fact, fracking is a lot more like mining than conventional oil production. Mining companies need to dig new holes, year after year, to extract reserves of copper or iron ore. In fracking, there is intense pressure to keep replacing the production you lost last year.
On average, the “all-in,” breakeven cost for U.S. hydraulic shale is $65 per barrel, according to a study by Rystad Energy and Morgan Stanley Commodity Research. So, with the current price at $48, the industry is under siege. To be sure, the frackers will continue to operate older wells so long as they generate revenues in excess of their variable costs. But the older wells–unlike those in the Middle East or the North Sea–produce only tiny quantities. To keep the boom going, the shale gang must keep doing what they’ve been doing to thrive; they need to drill many, many new wells.
Right now, all signs are pointing to retreat. The count of rotary rigs in use–a proxy for new drilling–has fallen from 1,930 to 1,881 since October, after soaring during most of 2014. Continental Resources, a major force in shale, has announced that it will lower its drilling budget by 40% in 2015. Because of the constant need to drill, frackers are always raising more and more money by selling equity, securing bank loans, and selling junk bonds. Many are already heavily indebted. It’s unclear if banks and investors will keep the capital flowing at these prices.
I think long-term Canadian oil sand projects will have a stronger future, because they have more fundamental validity and less bubble finance hype (although there is some of that, of course). And while it it doesn’t seem like it to individual market participants, prices ultimately determine costs and so lower prices will push costs down. Rates of return in the market tend to equalize across different industries — there is not legitimate reason why people should forever expect above-market wages and investment returns in the oil business.
CENTRAL BANKS BACKING OFF?
Because I believe the Austrian business cycle theory is correct, I think China’s tightening of monetary policy has been a major factor here.
Likewise the Federal Reserve, with its 7x increase in the size of its balance sheet, culminating with a “taper” and proceeding into deflation mode following the end of QE3. That’s right, deflation mode. They did not just “taper” the rate of growth on the monetary base then hold it steady. The Fed actually sold off 10% of its assets starting in September before jumping back into open market operations with $250 billion in purchases. This kind of behavior is very disorienting for the market, with capital markets adjusting to money being sucked out and then pumped back in. But it helps explain the strengthening of the USD and the bloodshed in the commodities markets.

Then on Jan 15 came the Swiss National Bank’s surprise decision to end its foolhardy 1.20 EUR peg before Drahgi opened the ECB money floodgates. In its Keynesian desperation to diminish CHF purchasing power, the SNB’s balance sheet increased fivefold since the financial crisis and it amassed assets equal to 100% of the nation’s GDP — which is even more extreme than the insane BOJ, if you can believe it. With this development, the franc soared against the Euro and the US dollar and baffled everyone, even destroying a couple of FX firms overnight in one fell swoop.
Things will get crazy as some central banks tighten and others keep printing. These currency dislocations could lead to a currency crisis somewhere, but that is hard to predict. In any case, the insanity meter is in the red.
WHAT ABOUT GOLD?
Gold and oil often move together. And when the US dollar strengthens, gold usually weakens. But we are not really seeing this. Gold has been quite resilient amidst falling commodity prices and is performing well so far in 2015.

In this case, I’m not entirely sure what this means. On the one hand, it could indicate that a recession is less likely. On the other hand, it could indicate that investors are worried and are hedging against danger, like more aggressive central bank interventions.
CONCLUSION
The “correction” is healthy. It means reallocating resources to their most economical use. But it is painful — like a heroin addict going into detox.
It would be good for the world if oil went down to $20 a barrel and stayed there for 20 years, but I think the “peak oil” thesis is basically correct, and prices will rise again. We might not see a radical swing like in the 2008 crash, where we went from $37 back to $80 within the year.
The timing for all this depends on what happens in the recovery phase. Major readjustments need to occur. These adjustments could be brutal and quick, and the economy could resume a healthy course within a year, so long as the myriad governments take a “laissez-faire” approach. If governments impair economic adjustment with more taxes, spending, and inflation, we’ll just get a huge mess because the economy is straining against maximum debt levels and a huge bounce-back recovery a la 2008-2009 is not going to work this time.
So there you go. Prepare for some trouble. Hold cash.
January 7, 2015 1 Comment
It looks like the Bank of Canada is slowing the growth of the monetary base.
The Bank of Canada has been printing money like crazy in the last few years, beating up the dollar to artificially juice up exports, which supposedly, according to Keynesian-mercantilists like Poloz, stimulates the economy. (It doesn’t — it just means Canadians have to sell more stuff to buy the same amount of imports, which actually makes the country poorer.)
So a slowdown, or flattening, of the BoC’s frenzied asset buying is definitely a good thing. Especially as the American dollar is strengthening considerably.
South of the border, the Fed looks like it might be reversing its recent deflationary actions, where it had sold off a surprising 10% of its assets.
 Maintaining the “boom” phase of the business cycle requires an ever-increasing rate of monetary expansion. So these actions will put huge strain on their respective economies.
It often takes about a year for the effects of monetary policy to really be felt throughout the system. If the stabilization path continues, then Canada will probably go into a recession later this year.
HAPPY NEW YEAR!
July 15, 2014 Leave a comment
The Bank for International Settlements put out its annual report on June 29. It says that the recovery is driven primarily by new fiat money generated by central banks. As a result, the pricing of capital assets is badly distorted. The overall theme is Austrian, not Keynesian.
Here is the summary:
A new policy compass is needed to help the global economy step out of the shadow of the Great Financial Crisis. This will involve adjustments to the current policy mix and to policy frameworks with the aim of restoring sustainable and balanced economic growth.
The global economy has shown encouraging signs over the past year but it has not shaken off its post-crisis malaise. Despite an aggressive and broad-based search for yield, with volatility and credit spreads sinking towards historical lows, and unusually accommodative monetary conditions, investment remains weak. Debt, both private and public, continues to rise while productivity growth has extended further its long-term downward trend. There is even talk of secular stagnation. Some banks have rebuilt capital and adjusted their business models, while others have more work to do.
To return to sustainable and balanced growth, policies need to go beyond their traditional focus on the business cycle and take a longer-term perspective — one in which the financial cycle takes centre stage. They need to address head-on the structural deficiencies and resource misallocations masked by strong financial booms and revealed only in the subsequent busts. The only source of lasting prosperity is a stronger supply side. It is essential to move away from debt as the main engine of growth.
Resources have been grossly misallocated by these interventions. Chapter VI begins with the following observations:
Nearly six years after the apex of the financial crisis, the financial sector is still coping with its aftermath. Financial firms find themselves at a crossroads. Shifting attitudes towards risk in the choice of business models will influence the sector’s future profile. The speed of adjustment will be key to the financial sector again becoming a facilitator of economic growth.
The banking sector has made progress in healing its wounds, but balance sheet repair is incomplete. Even though the sector has strengthened its aggregate capital position with retained earnings, progress has not been uniform. Sustainable profitability will thus be critical to completing the job. Accordingly, many banks have adopted more conservative business models promising greater earnings stability and have partly withdrawn from capital market activities.
Looking forward, high indebtedness is the main source of banks’ vulnerability. Banks that have failed to adjust post-crisis face lingering balance sheet weaknesses from direct exposure to overindebted borrowers and the drag of debt overhang on economic recovery (Chapters III and IV). The situation is most acute in Europe, but banks there have stepped up efforts in the past year. Banks in economies less affected by the crisis but at a late financial boom phase must prepare for a slowdown and for dealing with higher non-performing assets.
Then it discusses commercial banks — they are relying on the low interest rate environment to keep submarginal borrowers afloat. This is postponing inevitable losses.
In the United States, non-performing loans tell a different story. After 2009, the country’s banking sector posted steady declines in theaggregate NPL ratio, which fell below 4% at end-2013. Coupled with robust asset growth, this suggests that the sector has madesubstantial progress in putting the crisis behind it. Persistent strains on mortgage borrowers, however, kept the NPL ratios of the two largest government-sponsored enterprises above 7% in 2013.Enforcing balance sheet repair is an important policy challenge in the euro area. The challenge has been complicated by a prolonged period of ultra-low interest rates. To the extent that low rates support wide interest margins, they provide useful respite for poorly performing banks. However, low rates also reduce the cost of – and thus encourage – forbearance, ie keeping effectively insolvent borrowers afloat in order to postpone the recognition of losses. The experience of Japan in the 1990s showed that protracted forbearance not only destabilises the banking sector directly but also acts as a drag on the supply of credit and leads to its misallocation (Chapter III). This underscores the value of the ECB’s asset quality review, which aims to expedite balance sheet repair, thus forming the basis of credible stress tests.
The holy grail of central banking is this: shrink asset bubbles without crashing the economy.
No central bank has ever accomplished this. Yet monetary central planners have big egos — they think they are the smartest people in the entire universe. Right now, they think they have the economy under their control — unemployment slowly falling, economic activity slowly improving, and consumer price inflation is nowhere in sight.
Business cycle “recovery” phases (even weak ones) can’t last forever. The question is, can they pull off their ultimate gambit?
If central banks can unwind the massive increases to their balance sheets without causing recessions, it will show that Keynesian economics works. It will be nothing short of a miracle.
Do you believe in miracles?
June 24, 2014 Leave a comment
The Bank of Canada’s balance sheet is now bigger than ever. The central bank grows fat on the debts created by Ottawa.

The rate of growth had slowed a bit in recent months, but the latest data tells us that Governor Poloz really doesn’t know what to do other than create new money and buy stuff. This is exasperating the business cycle and driving down the price of the Canadian dollar.
The Bank of Canada’s assets are 99% Canadian government bills and bonds. Buying more of these bids up their prices and pushes interest rates lower than they would be otherwise.
The newly created money enters the capital markets, and begins distorting the market’s allocation of resources. This is the cause of business cycles.
Interestingly, rates are so low in Canada that capital is nearly free, but the Eastern economy is still a mess. According to Keynesianism, the entire country should be on the verge of Utopia.
The aggressive monetary policy was kicked off by Carney, shortly after selling off the Bank’s emergency acquisitions of the financial crisis. Poloz is continuing this policy. He is trying to juice the Canadian economy by driving down the value of the Canadian dollar, thereby increasing exports, as he told us in his April 16 rate decision. This kind of short-sighted and special-interest-serving policy is to be expected from central bankers, particularly ones who worked Export Development Canada for more than a decade, like Poloz.
Hilariously, a few days ago the mainstream media churned out a puff piece about how Poloz is the “king” of central bankers and other central bankers want to be like him. The article presents Poloz as a really cool dude because when he says something, the Canadian dollar’s value is more greatly affected than the value of other currencies when their central bankers talk.
It never seems to occur to anyone that this is a horrible, horrible thing. It shows that the dollar is dangerously sensitive to the whims of central bankers, and that is not healthy for an economy. Uncertainty due to regulatory hazard is destructive to economic opportunity.
But of course, words are one thing, and the biggest impact on the economy emerges from the BoC’s actions — i.e. printing money. And as we can see, the Bank of Canada still going full steam ahead with that plan.
June 9, 2014 1 Comment
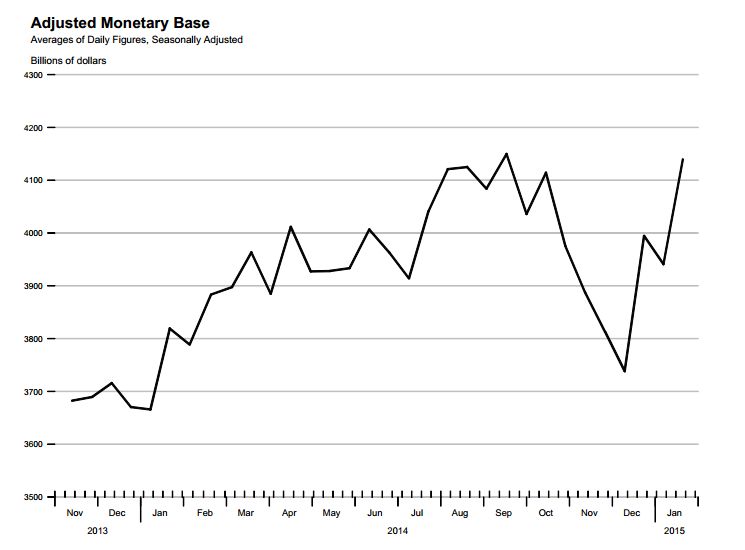
The Bank of Canada has somewhat arrested the rate of growth on its balance sheet. The monetary base has reached a bit of a “plateau” for now, very close to all-time highs from December 2013 ($91.045 billion on the books as of April 30 2014).
It seems Poloz is trying to follow along with the general “tapering” strategy of the Fed. In order to maintain the “boom” of this business cycle (as lame a boom as it might be), the balance sheet’s size must continue to trend higher. But the flattening of the curve means that the BoC’s purchases are slowing. This will tend to push down asset prices.

April 5, 2014 1 Comment
(NOTE TO READER: There was a considerable time lag between the beginning of the QE3 taper’s declared beginning and when it actually started. This article was written during the lag, suggesting that the taper was all hype and no reality. Since then, the taper did become real and QE3 ended.)
The much-talked-about taper could be nothing more than a big joke. Where is the statistical evidence of the taper?
Let’s look at the last 10 years of the Federal Reserve’s balance sheet.
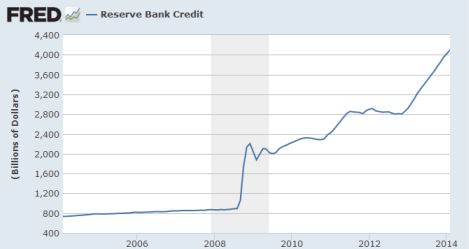
Here you can see all three QEs laid out nicely.
Let’s “zoom in” and look at just the last year.

The rate of growth briefly slowed then picked right back up. Other purchases appear to be offsetting the taper, at least so far. On net, no taper. Watch what they do, don’t fret too much over what they say (central bankers lie all the time).
Meanwhile, despite media reports and promises from European central bankers that they will inflate to prevent recession, the ECB is engaged in a deflationary policy, and has been for nearly a year.
Sometimes the official central bank statistics don’t match their words.
The Fed has been saying it will not let interest rates rise, yet at the same time it will slow its rate of purchasing assets. I don’t know how that is supposed to work, since regardless of the Federal Funds target rate, the market sets the real Federal Funds rate. Yet it almost makes sense if you assume while they might buy less crap via QE3, they will balance that with more purchases of different crap.
February 12, 2014 1 Comment
Canada’s housing market has soared while the US market crashed.

–
Canada has the most overvalued housing market in the world:

–
The WSJ recently commented:
Canada, for example, is very open to foreign investors, which means that in an age of unprecedented global liquidity cash-rich wealthy individuals who are looking for places to park their excess funds can do so in its housing market far more easily than in Japan, with its closed system.
Now, the Canadian government is eliminating “its controversial investor Visa scheme, which has allowed waves of rich Hongkongers and mainland Chinese to immigrate since 1986.”
The story continues in The South China Morning Post:
Canada’s government has announced that it is scrapping its controversial investor visa scheme, which has allowed waves of rich Hongkongers and mainland Chinese to immigrate since 1986.
The surprise announcement was made in Finance Minister Jim Flaherty’s budget, which was delivered to parliament in Ottawa on Tuesday afternoon local time. Tens of thousands of Chinese millionaires in the queue will reportedly have their applications scrapped and their application fees returned.
The decision came less than a week after the South China Morning Post published a series of investigative reports into the controversial 28-year-old scheme.
The Post revealed how the scheme spun out of control when Canada’s Hong Kong consulate was overwhelmed by a massive influx of applications from mainland millionaires. Applications to the scheme were frozen in 2012 as a result, as immigration staff struggled to clear the backlog.
“In recent years, significant progress has been made to better align the immigration system with Canada’s economic needs. The current immigrant investor program stands out as an exception to this success,” Flaherty’s budget papers said.
“For decades, it has significantly undervalued Canadian permanent residence, providing a pathway to Canadian citizenship in exchange for a guaranteed loan that is significantly less than our peer countries require,” it read.
Under the scheme, would-be migrants worth a minimum of C$1.6 million (HK$11.3 million) loaned the government C$800,000 interest free for a period of five years. The simplicity and low relative cost of the risk-free scheme made it the world’s most popular wealth migration program.
A parallel investor migration scheme run by Quebec still remains open. Many Chinese migrants use the alternative scheme to get into Canada via the French-speaking province and then move elsewhere in Canada. The federal government has previously pledged to crack down on what it said was a fraudulent practice.
Flaherty also announced yesterday the scrapping of a smaller economic migration scheme for entrepreneurs.
All told, 59,000 investor applicants and 7,000 entrepreneurs will have their applications returned, Postmedia News reported. Seventy per cent of the backlog, as of last January, was Chinese, suggesting more than 46,000 mainlanders will be affected by yesterday’s announcements.
The Immigrant Investor Program, which has brought about 185,000 migrants to Canada, was instrumental in facilitating an exodus of rich Hongkongers in the wake of the 1989 Tiananmen massacre and in the run-up to the handover. More than 30,000 Hongkongers immigrated using the scheme, though SAR applications have dwindled since 1997.
The investor visa plan is truly stupid and should be eliminated. The idea of requiring loans to the government in exchange for citizenship is incredibly perverse. All money lent to the government is wasted and hurts the economy. The Chinese and Hongkongers who participated in this program could have really invested that money in productive endeavors instead. But this is a double-whammy to the Canadian economy, because to pay back those loans the Canadian state must tax its citizens, which hurts the economy even more.
But what effect will this have on Canada’s housing bubble? It will reduce demand for Canadian real estate. That obviously doesn’t help keep prices high.
Yet the really critical factor is central bank policy. The Bank of Canada is not up to date on its financial statements, but as of November it held more assets than ever. I am interested to see whether Poloz will “taper” with his American counterparts.
My intuition says that he won’t. Poloz wants to keep down the Canadian dollar and subsidize exports. The Bank of Canada has been expanding its balance sheet since mid-2010. Canada’s M1 money supply has grown dramatically. Canada’s housing prices are high. Canada’s interest rates are low. Yield on Canadian government bonds have fallen below American bonds. Yet consumer prices are not rising quickly, so the Bank of Canada sees its policy as an epic success so far.
— Read more at zerohedge —
December 29, 2013 Leave a comment
Mainstream economists fail to see why crises occur.
